Plan Bay Area 2040 Final Plan
Final Plan Bay Area 2040
 go to previous page
go to next page
go to previous page
go to next page
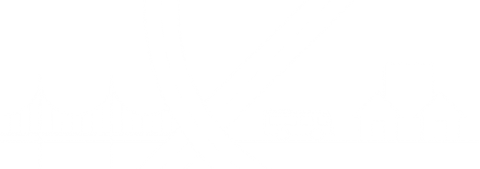
Housing near the Milpitas BART station provides a gateway to the workers of Silicon Valley.
Credit: Martin Klimek

Oakland is the third largest city in the Bay Area.
Credit: Karl Nielsen
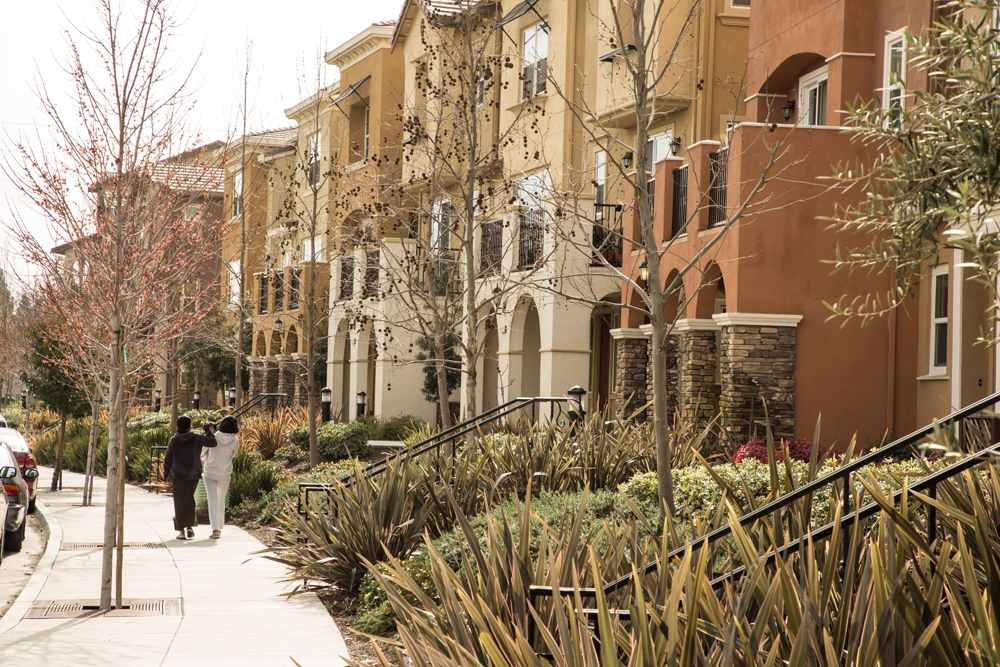
Napa is a renowned tourist destination in the Bay Area.
Credit: Karl Nielsen
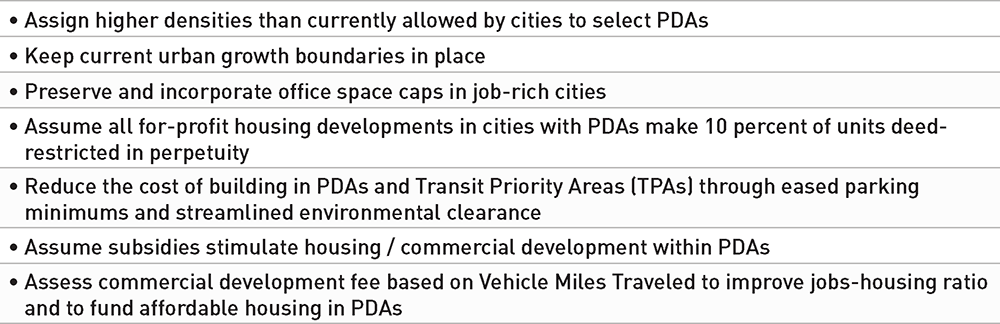
TABLE 4.1 Key land use assumptions.
Source: Metropolitan Transportation Commission, 2016
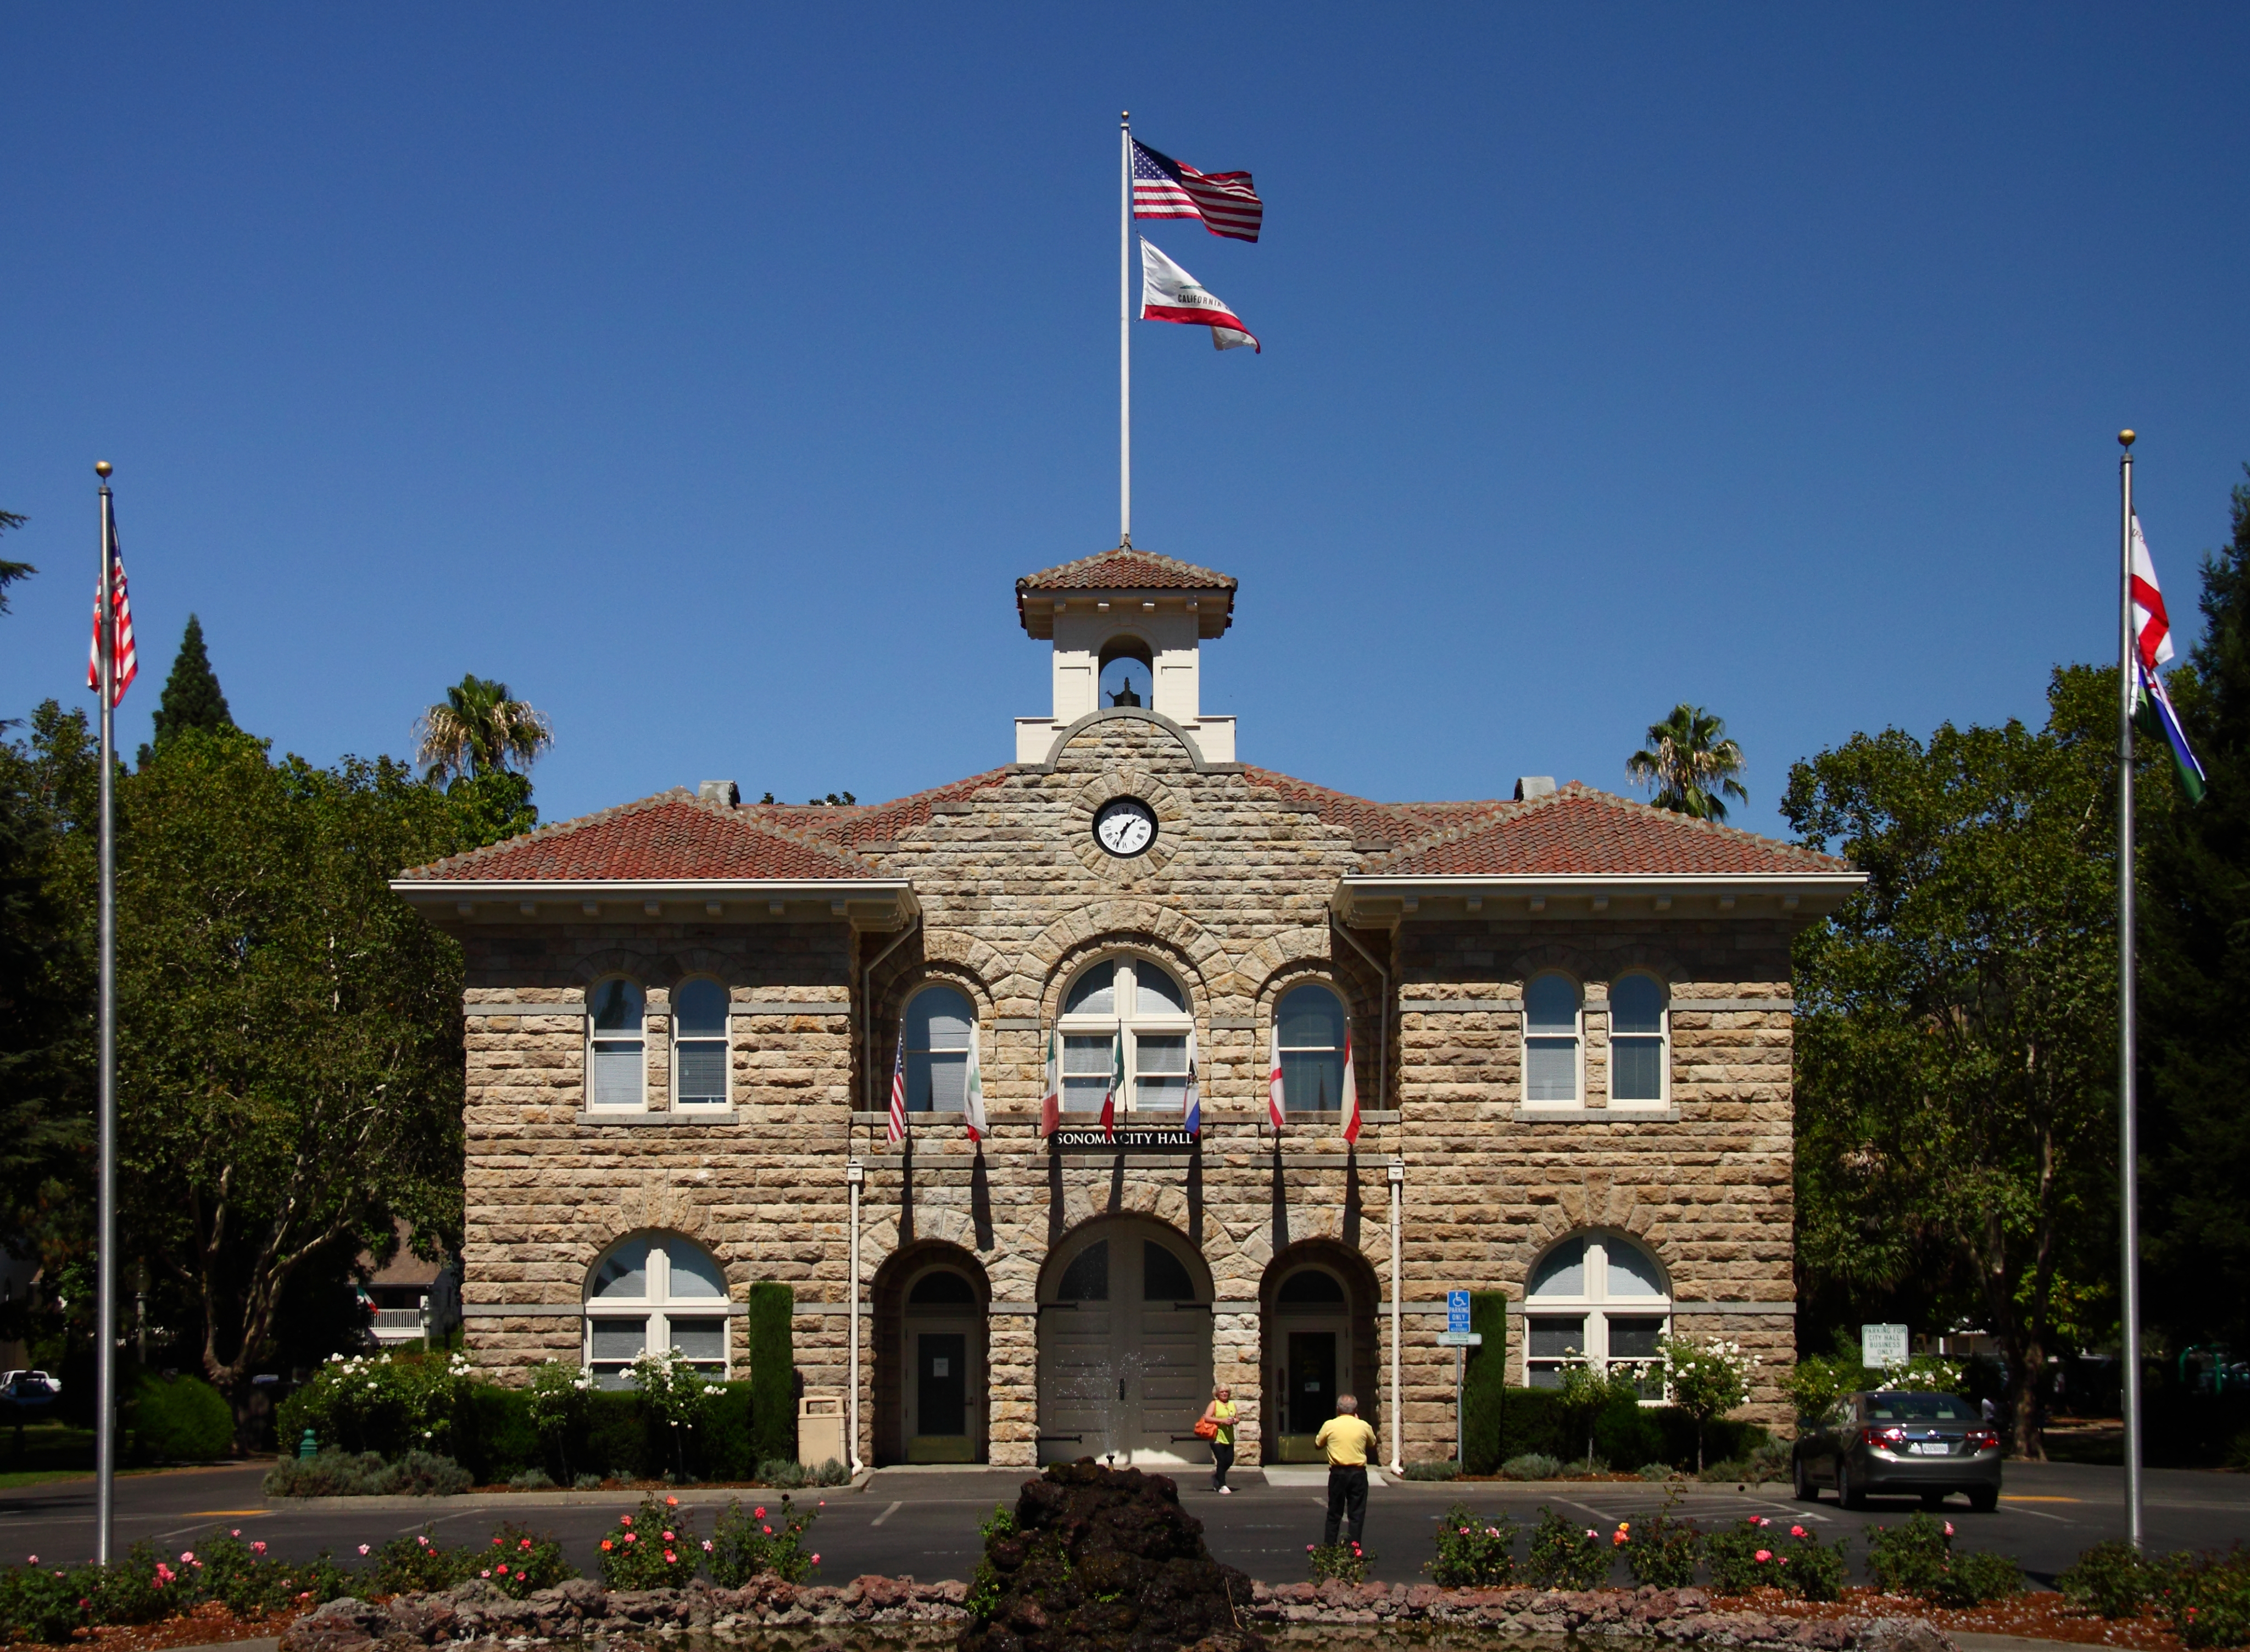
Sonoma City Hall
Credit: A Yee, Creative Commons Attribution 2.0 Generic license
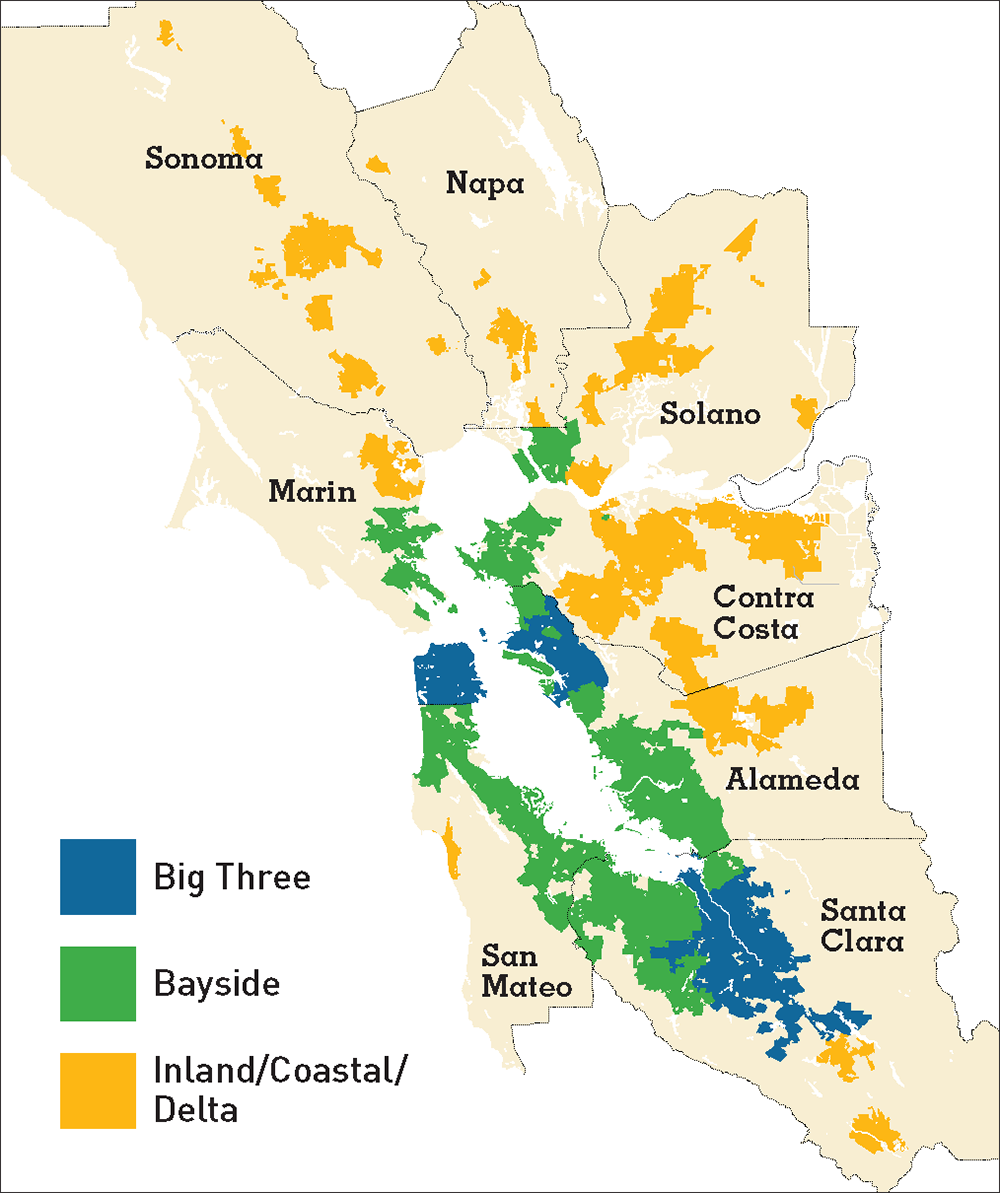
MAP 4.1 Bay Area subregions.
Source: Metropolitan Transportation Commission, 2016
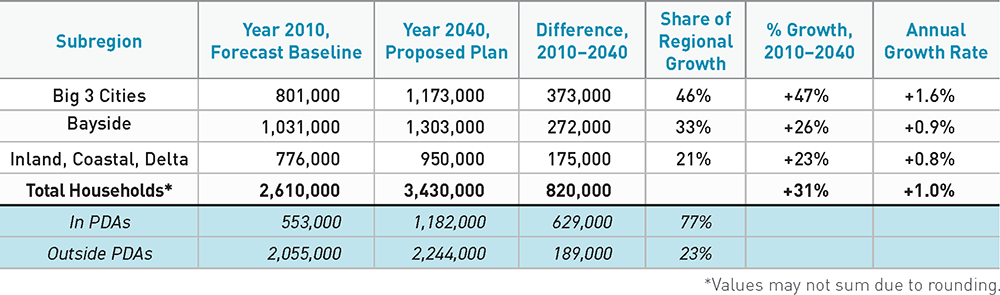
TABLE 4.2 Household growth by Bay Area subregion.
Source: Metropolitan Transportation Commission, 2016
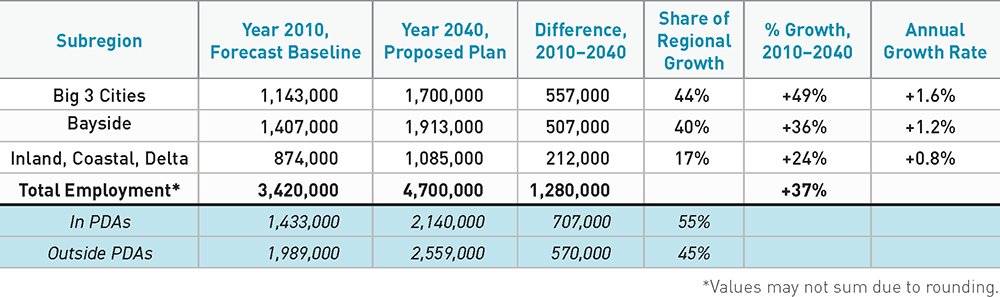
TABLE 4.3 Employment growth by Bay Area subregion.
Source: Metropolitan Transportation Commission, 2016
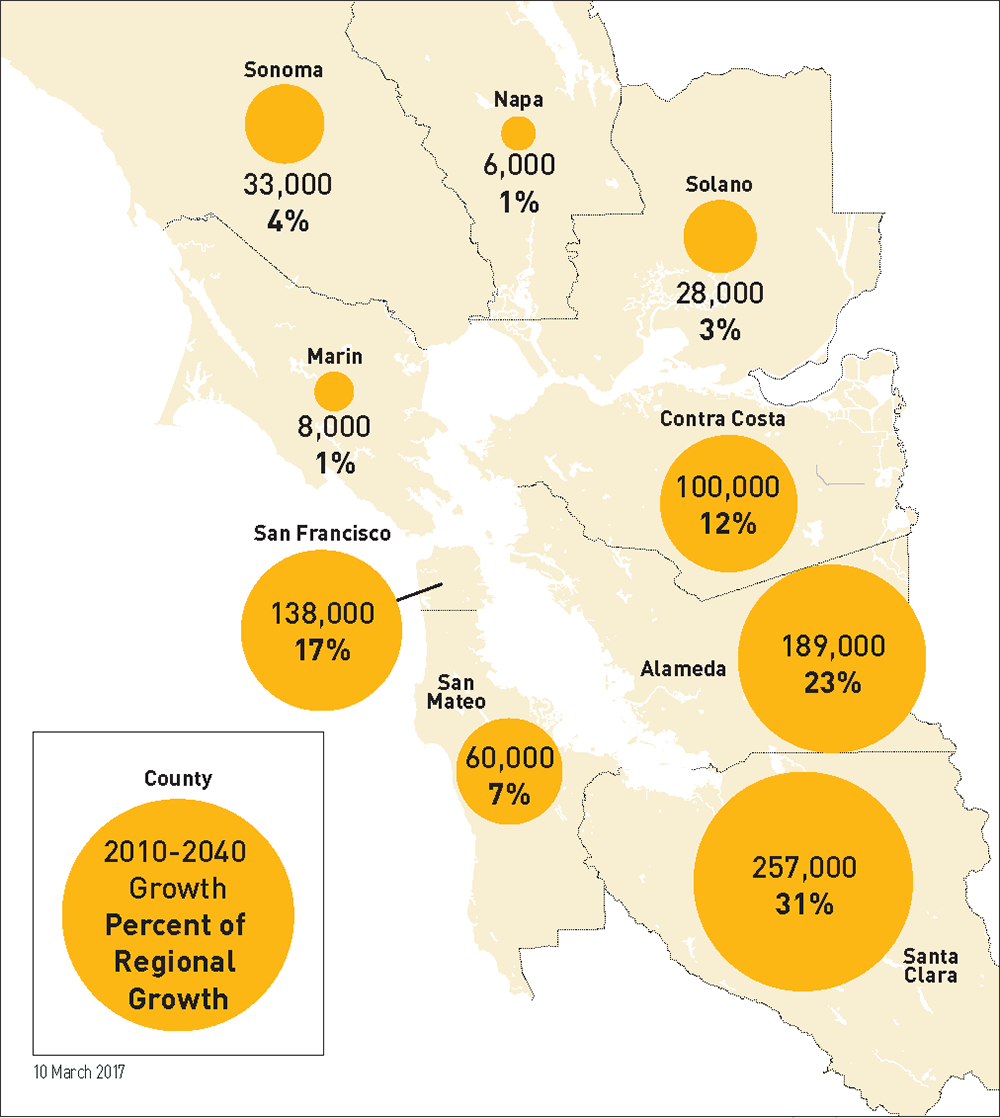
MAP 4.2 Household growth by county.
Source: Metropolitan Transportation Commission, 2016
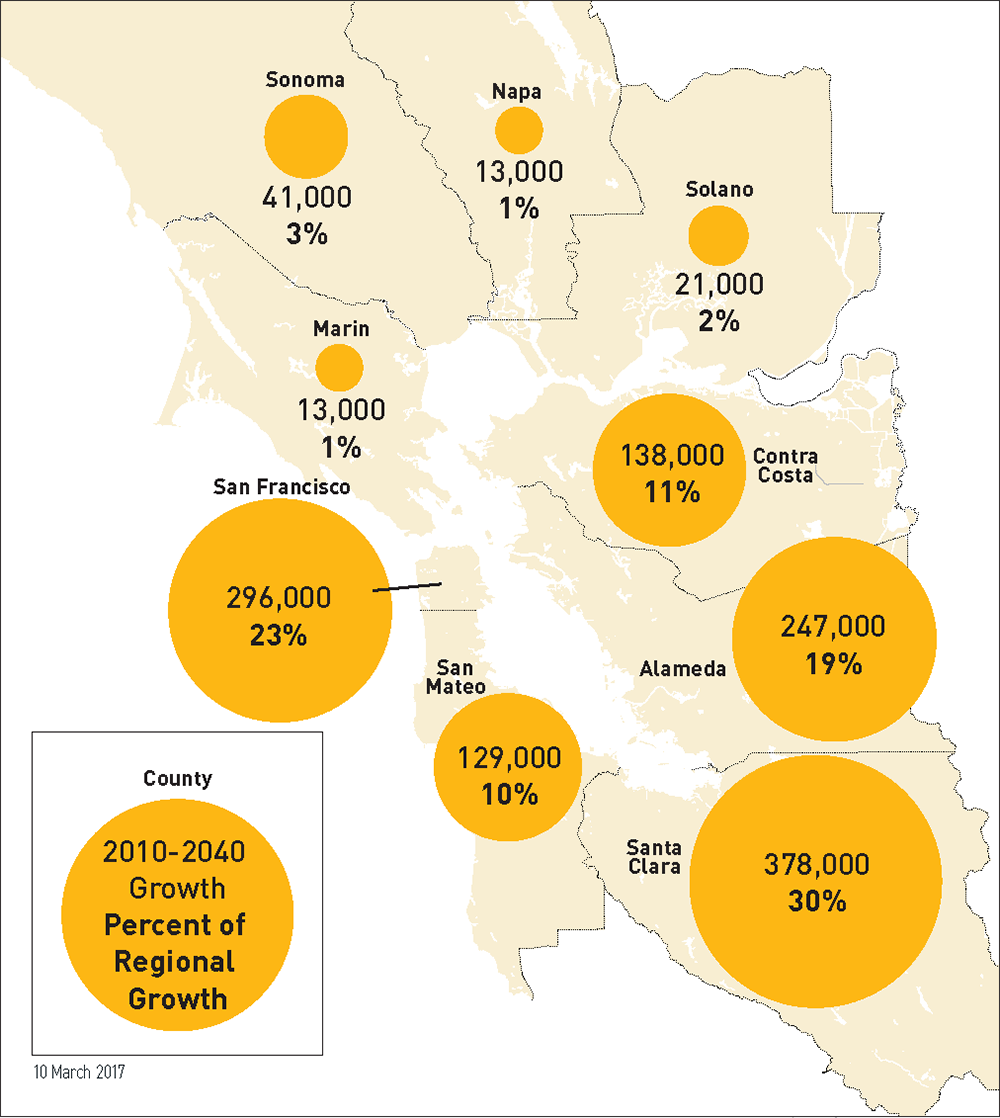
MAP 4.3 Employment growth by county.
Source: Metropolitan Transportation Commission, 2016
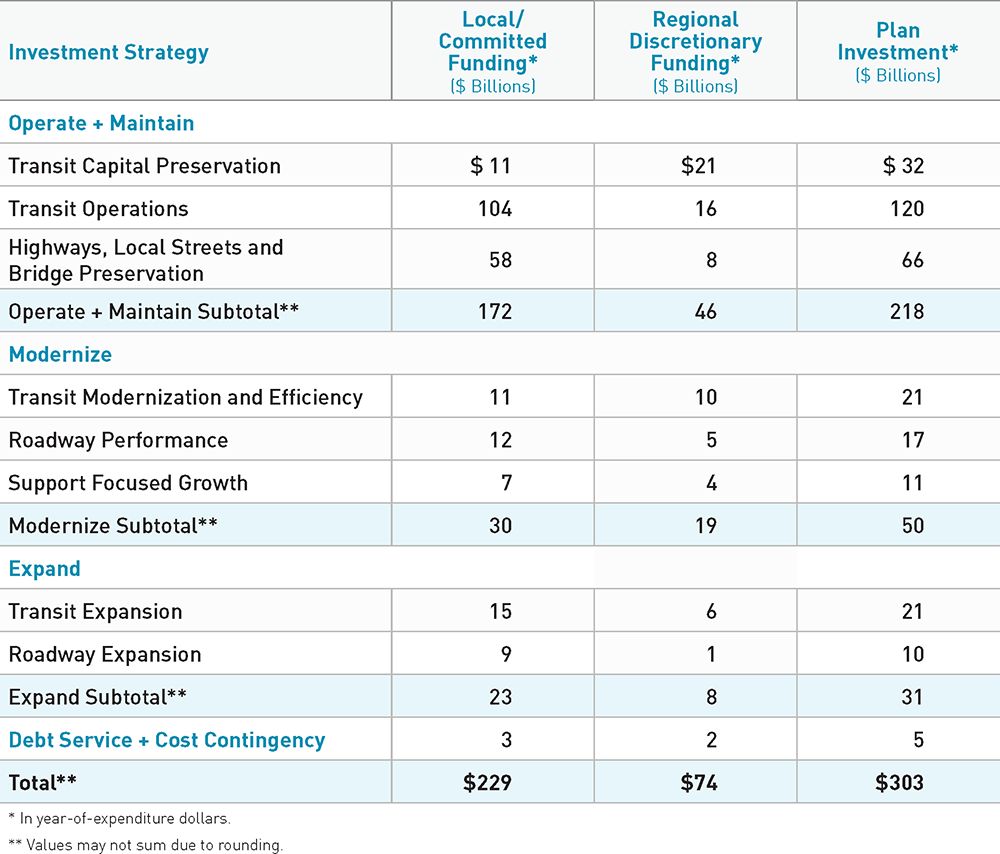
TABLE 4.4 Plan Bay Area 2040 funding distribution.
Source: Metropolitan Transportation Commission, 2016
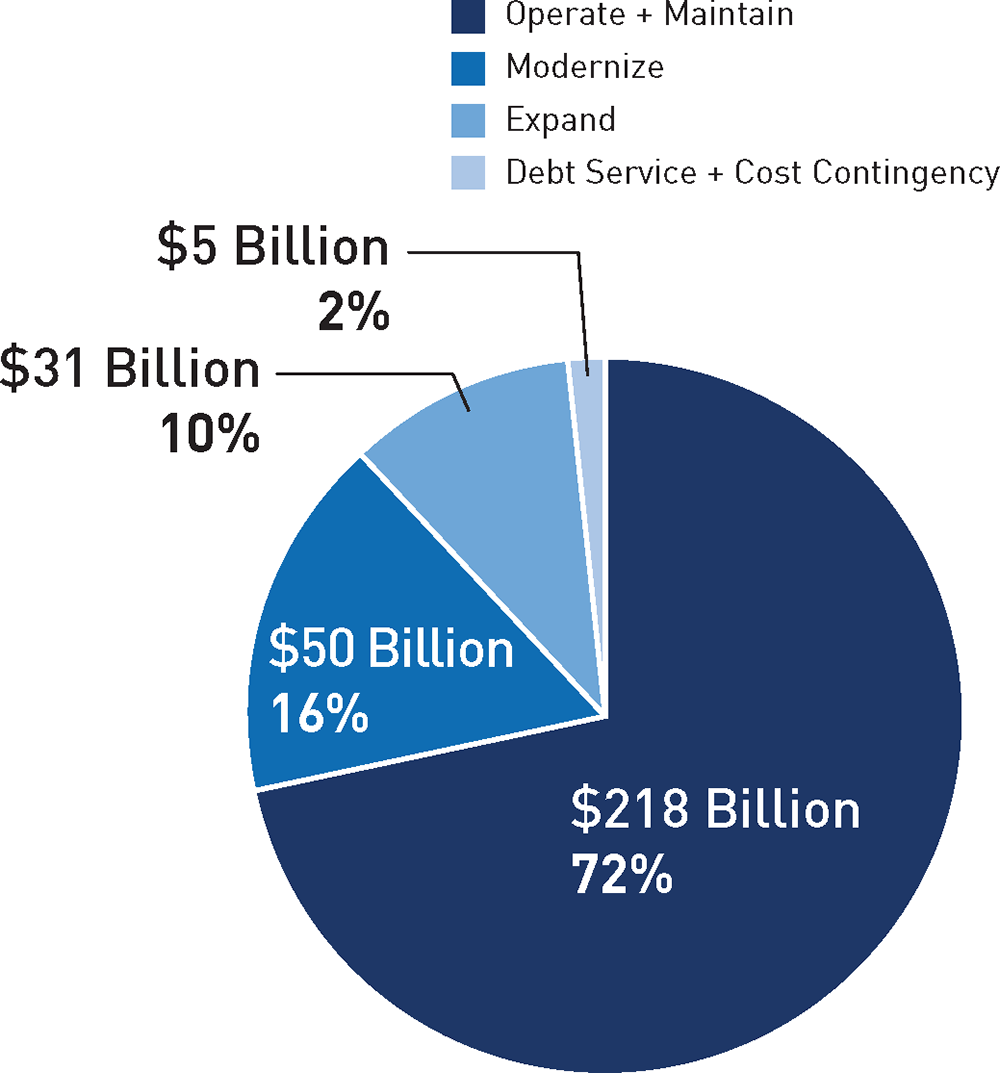
FIGURE 4.1 Plan Bay Area 2040 funding distribution.
Source: Metropolitan Transportation Commission, 2016
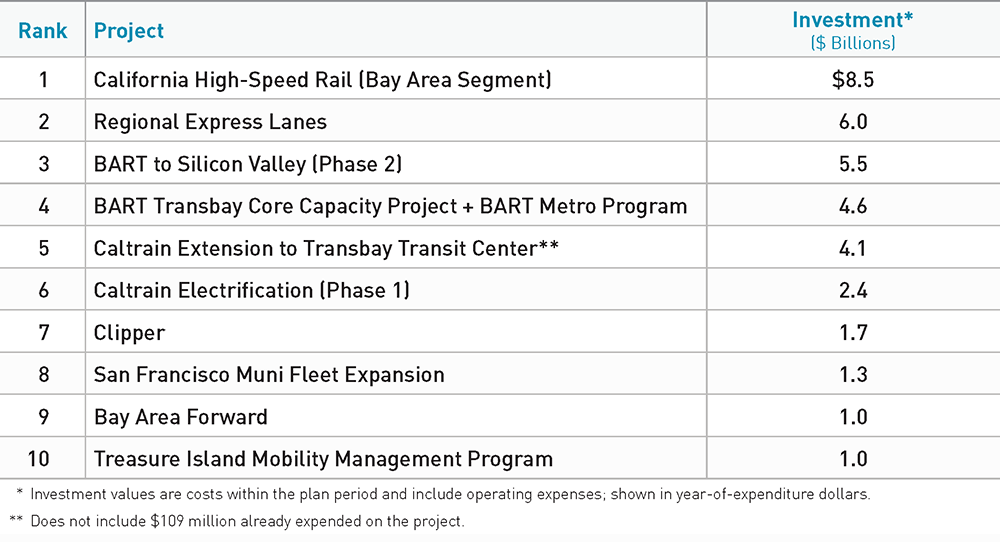
TABLE 4.5 Top 10 Plan Bay Area 2040 investments.
Source: Metropolitan Transportation Commission, 2016
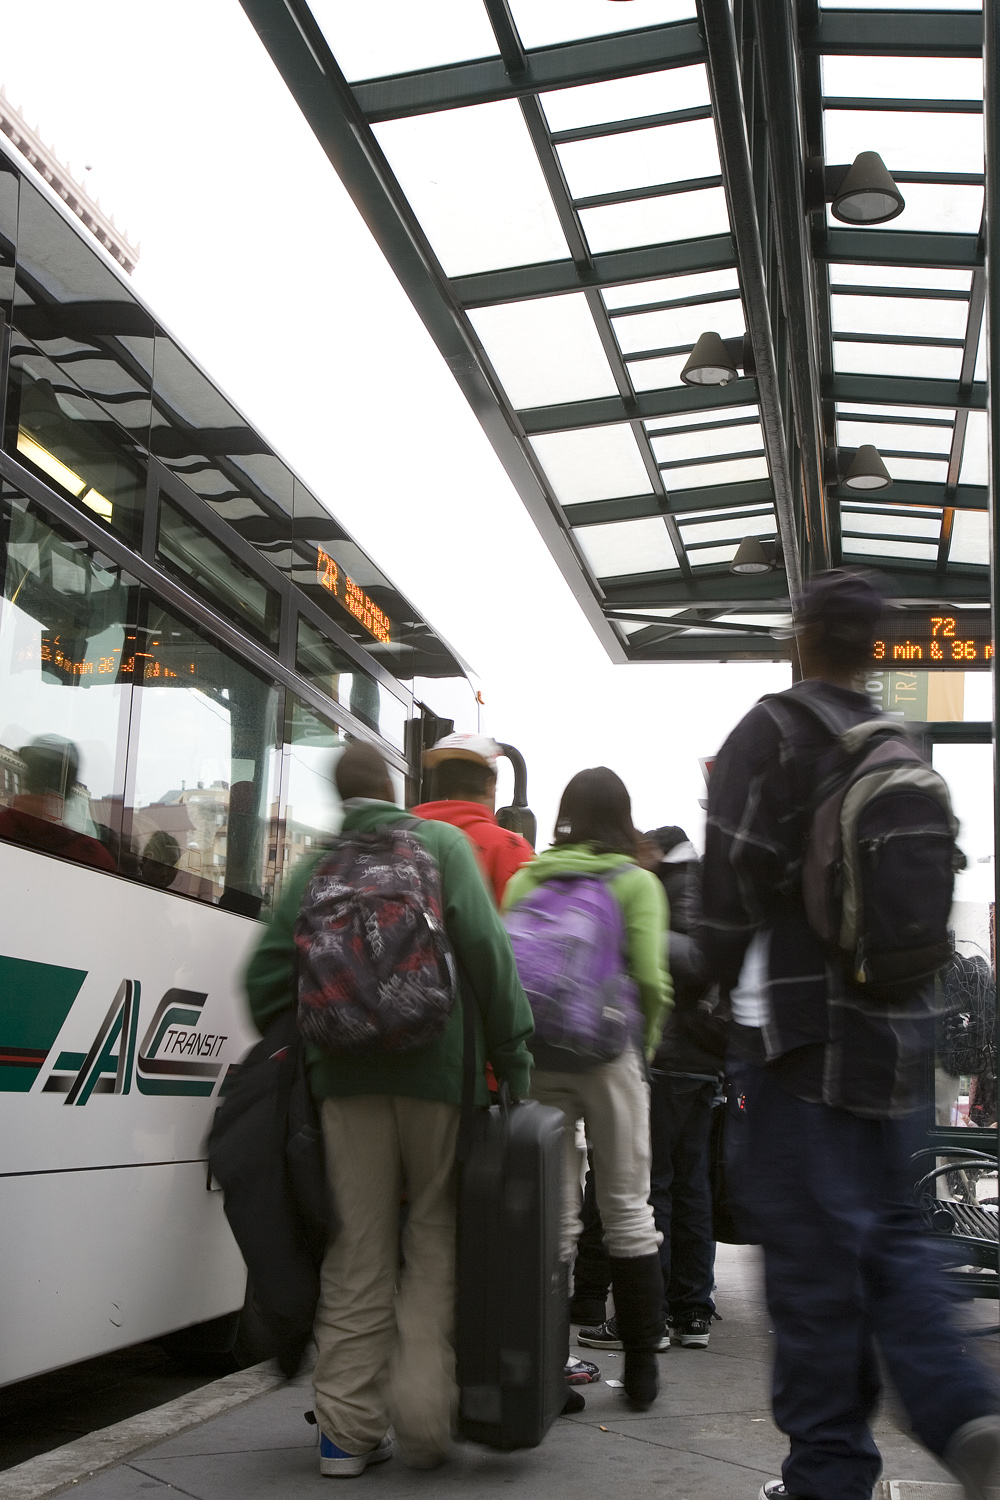
Passengers board an AC Transit bus.
Credit: MTC Archives
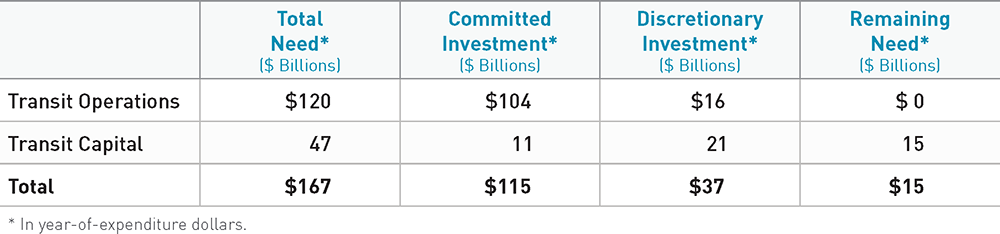
TABLE 4.6 Plan Bay Area 2040 transit operating and maintenance strategy.
Source: Metropolitan Transportation Commission, 2016
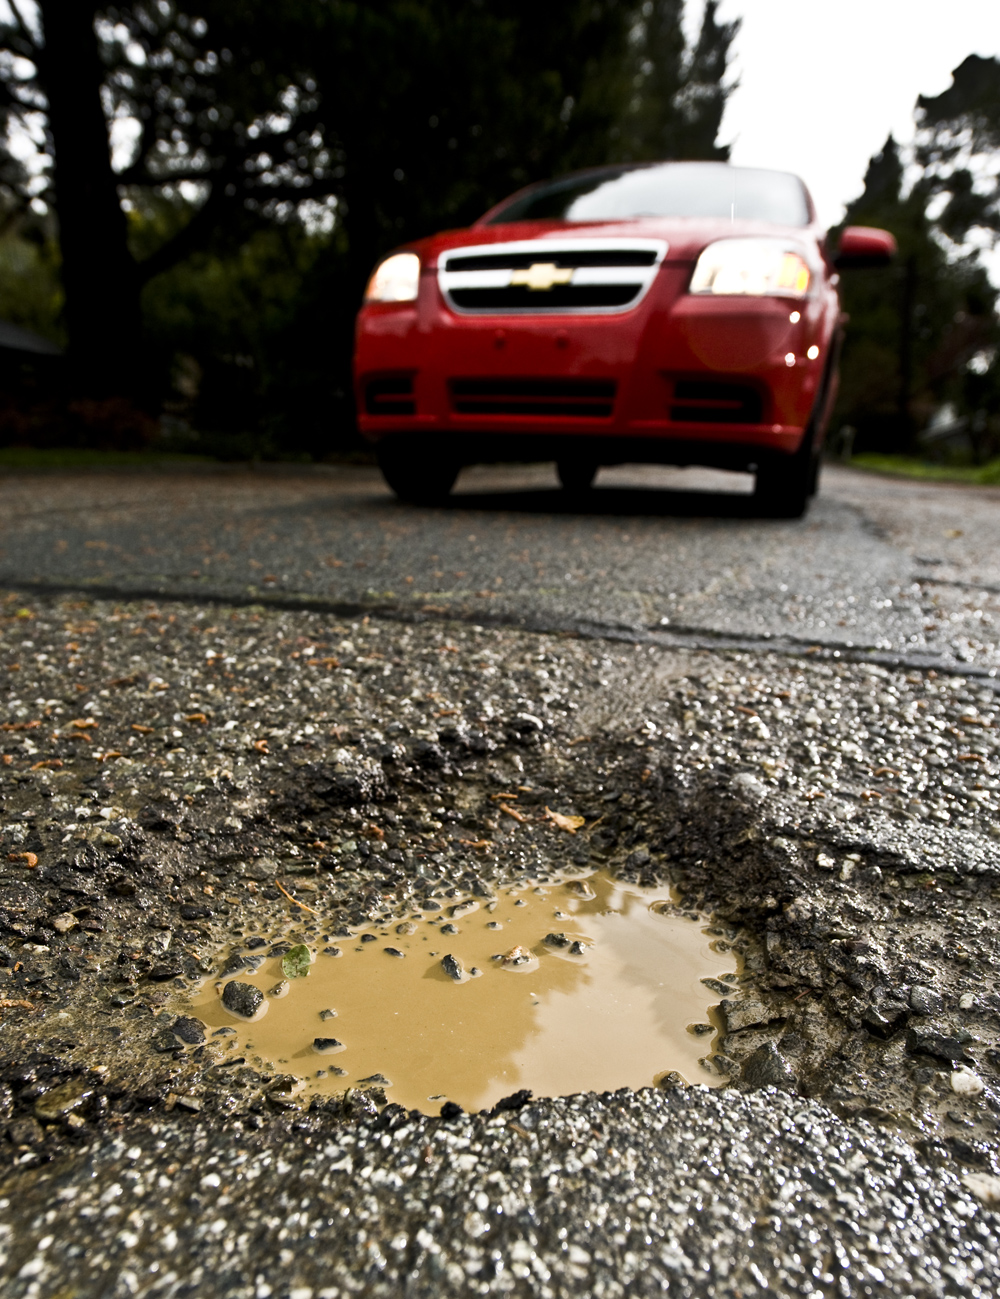
Road repair is a major infrastructure challenge for the Bay Area.
Credit: MTC Archives
Transit is a cornerstone of sustainability in the Bay Area.
Credit: Noah Berger
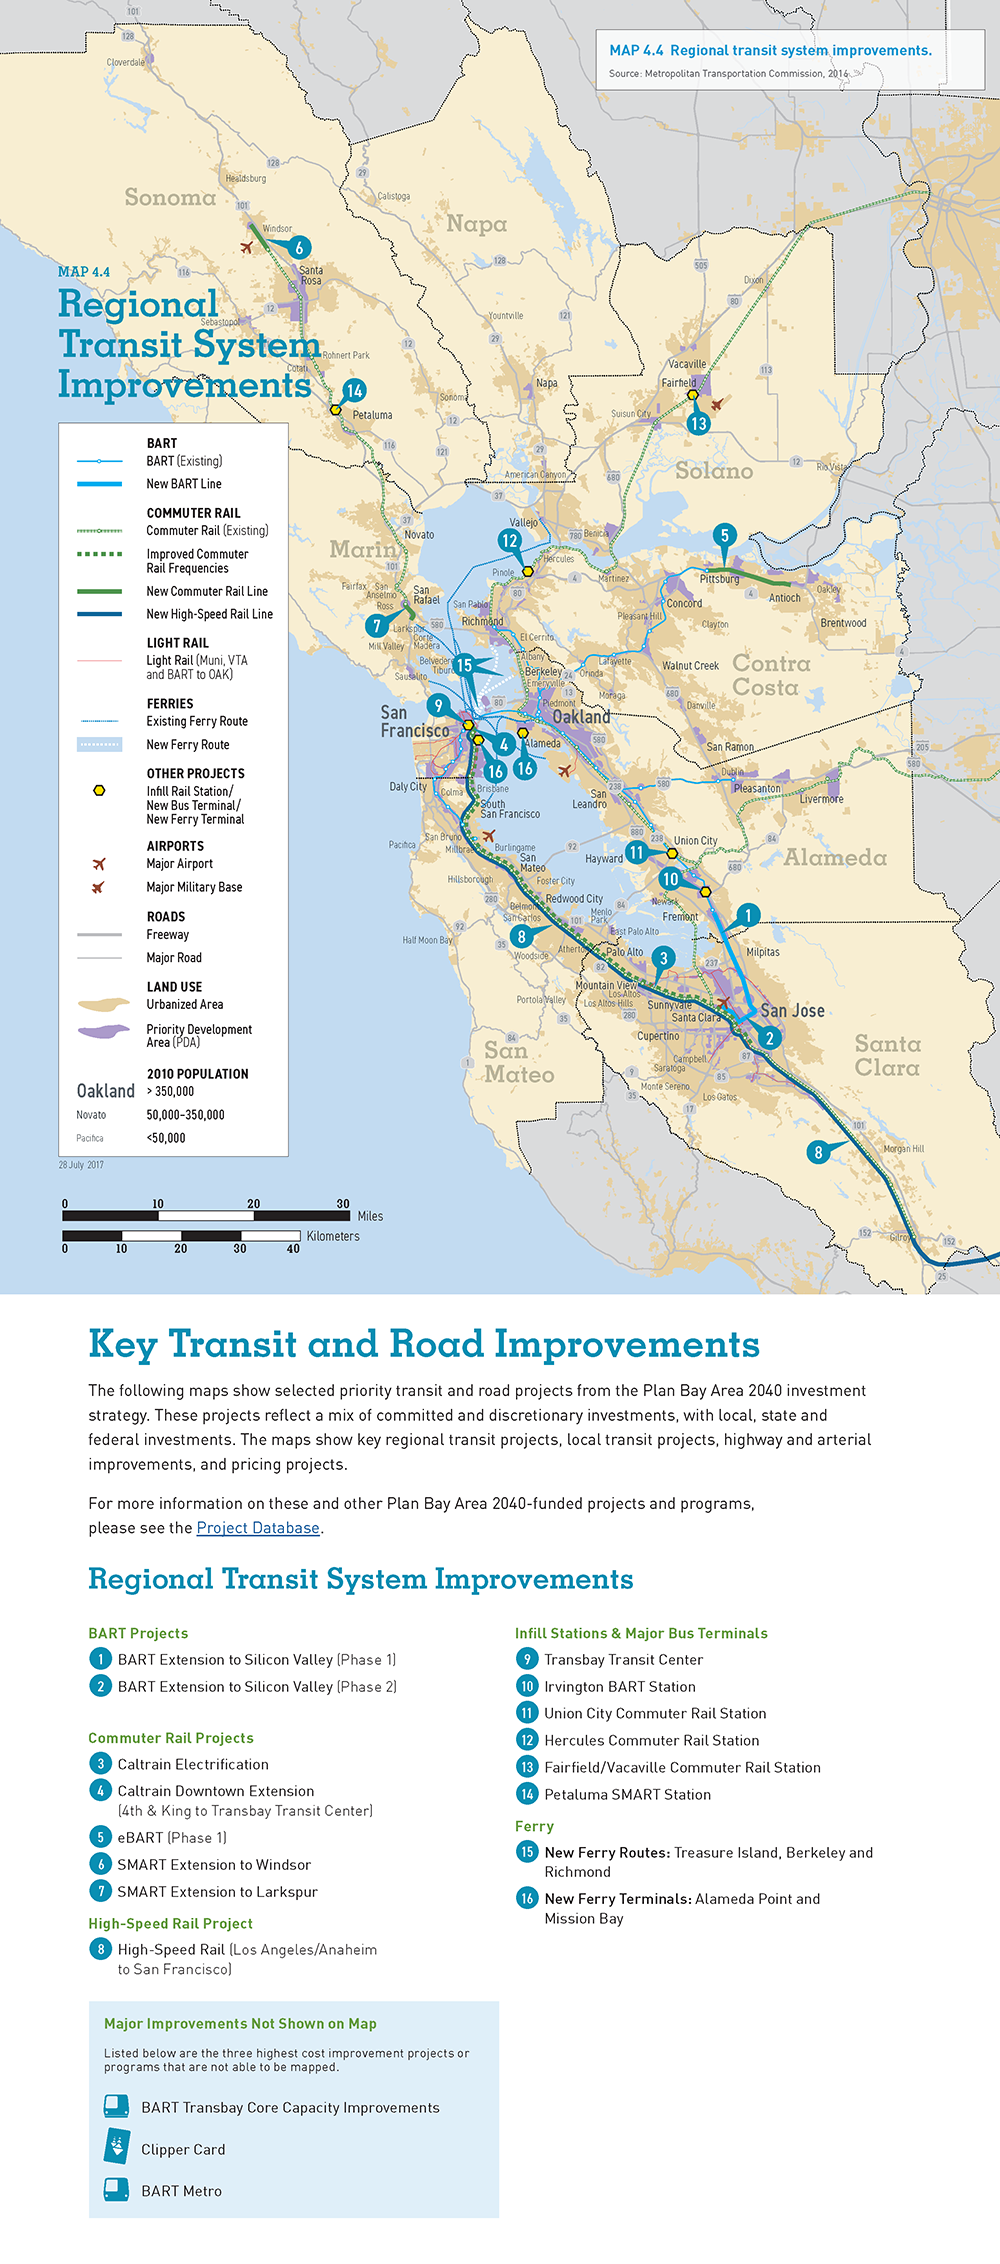
MAP 4.4 Regional Transit System Improvements
Source: Metropolitan Transportation Commission, 2016
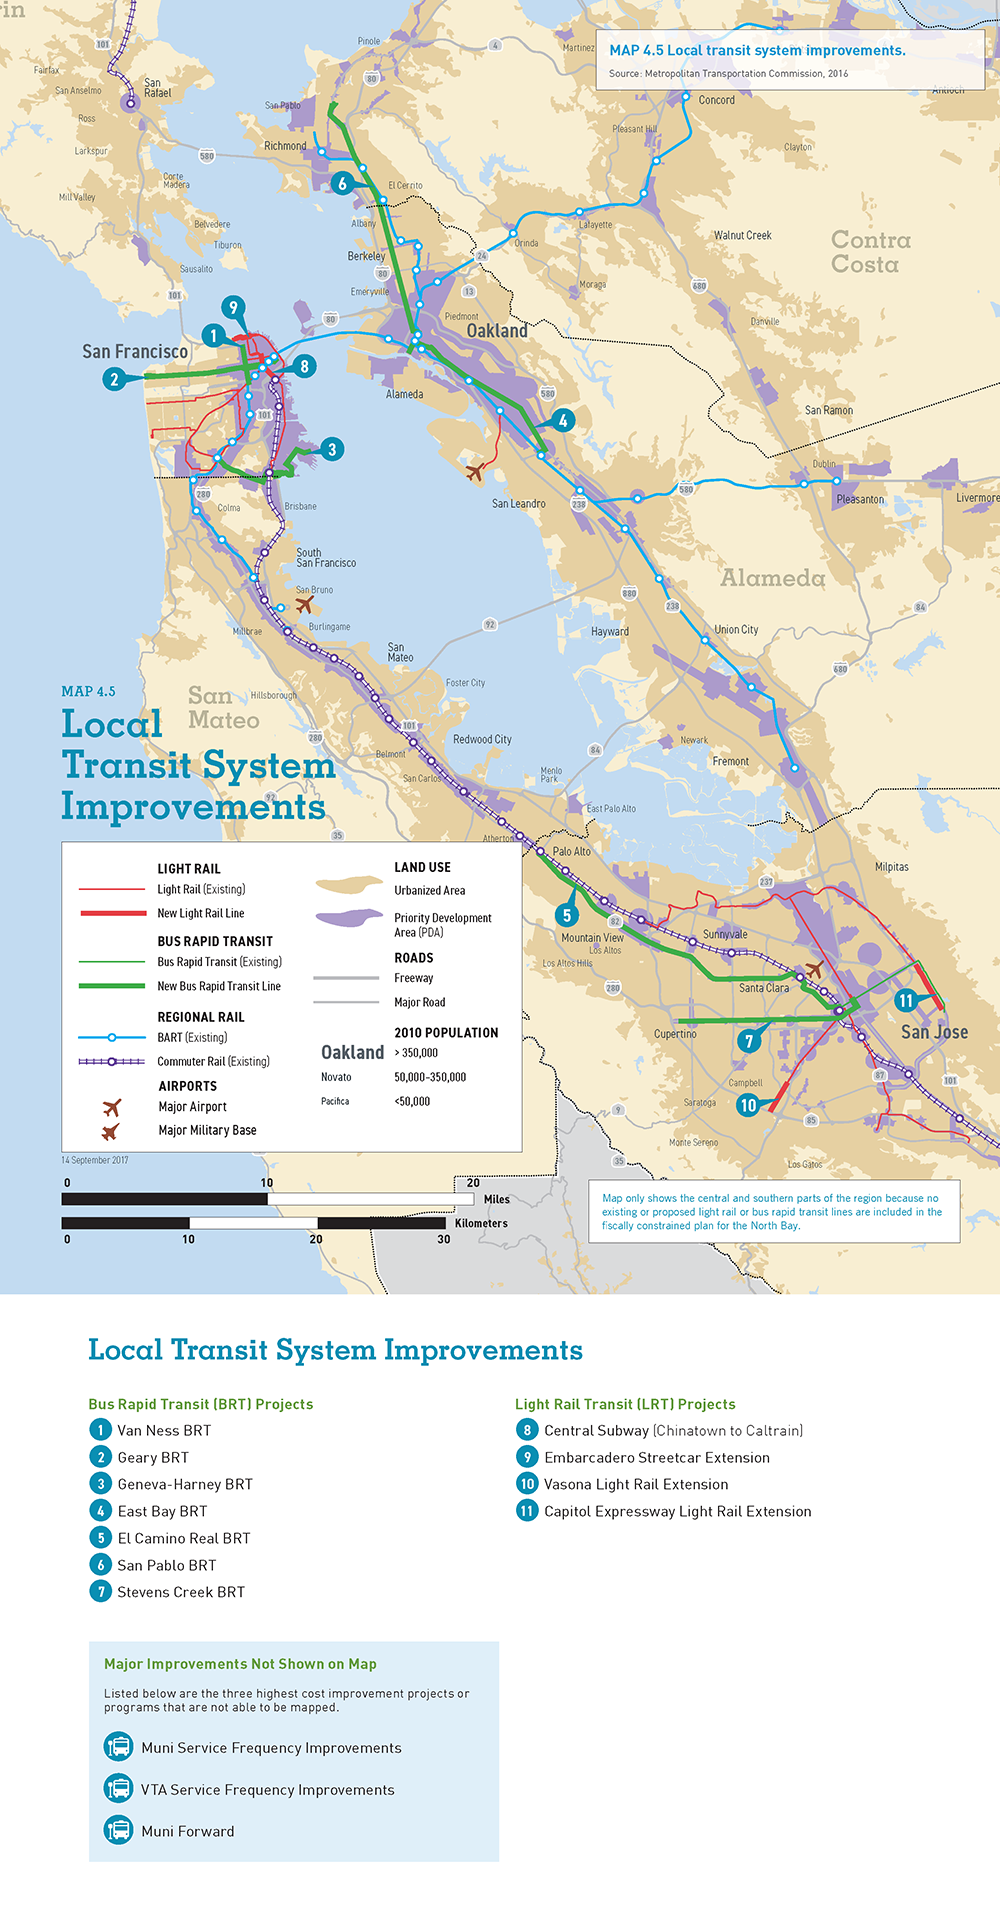
MAP 4.5 Local Transit System Improvements
Source: Metropolitan Transportation Commission, 2016
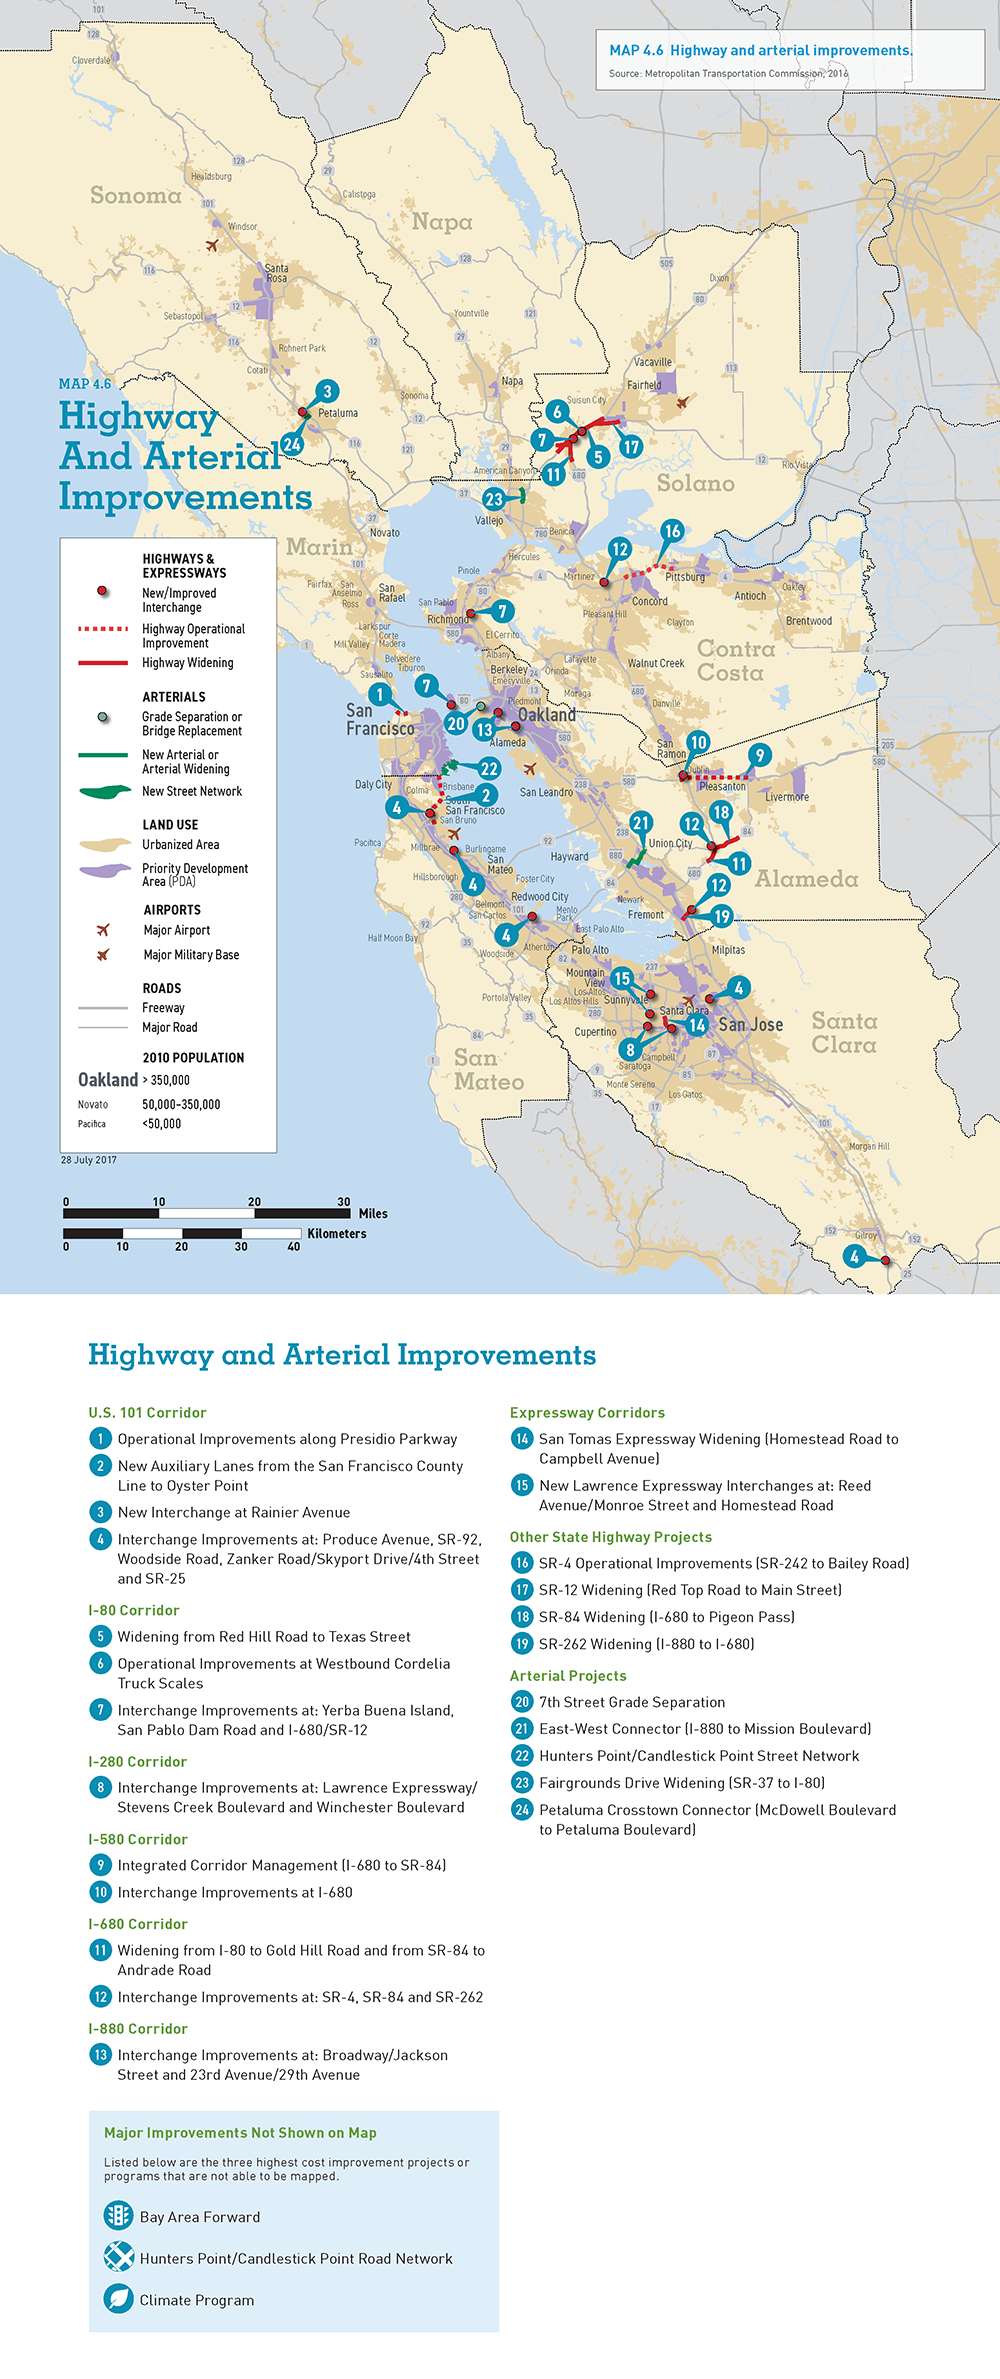
MAP 4.6 Highway and Arterial Improvements
Source: Metropolitan Transportation Commission, 2016
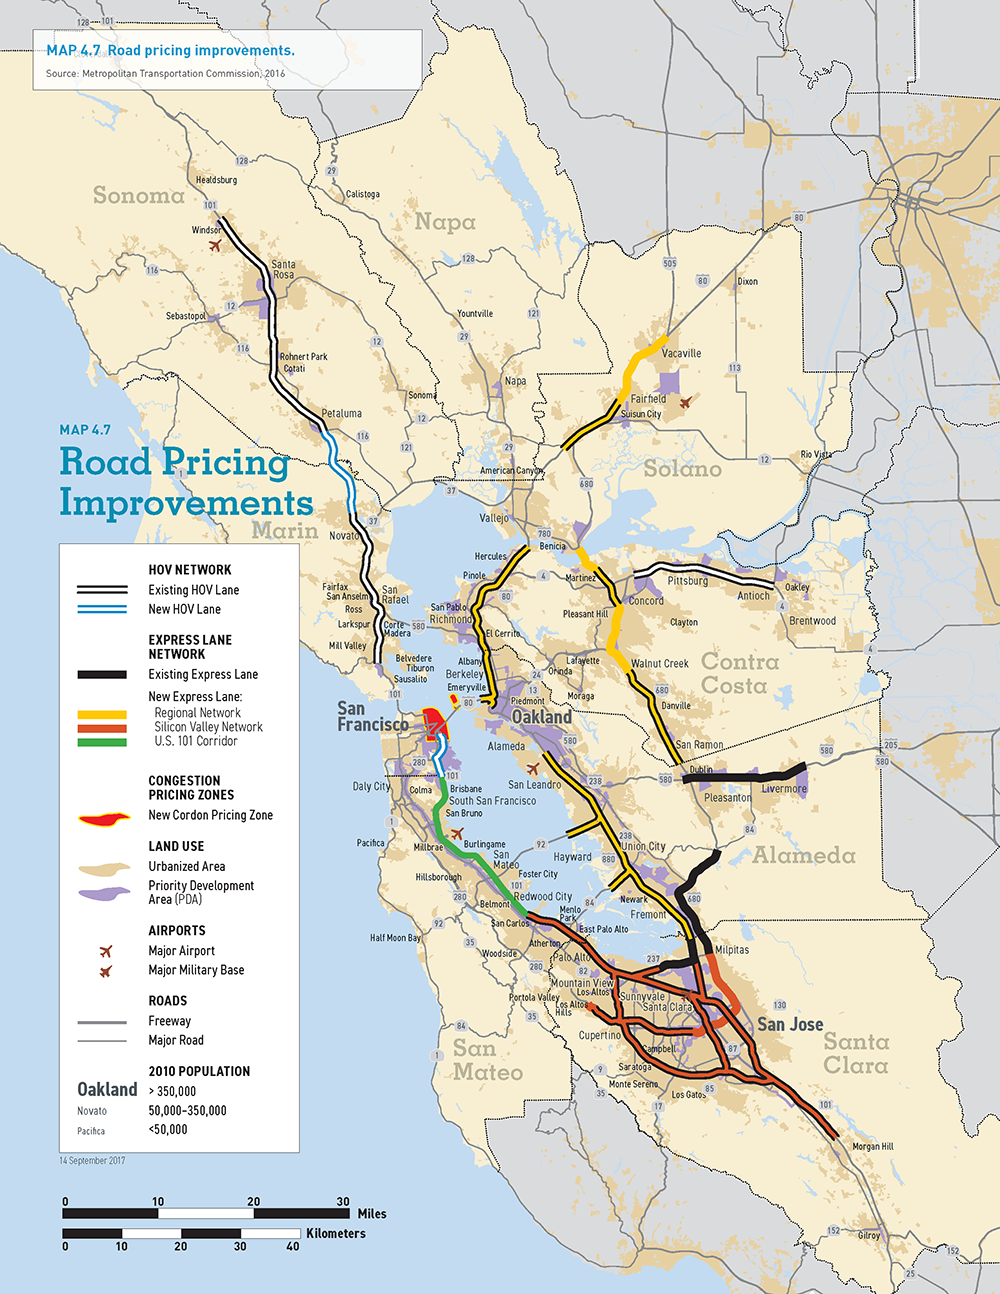
MAP 4.7 Road Pricing Improvements
Source: Metropolitan Transportation Commission, 2016
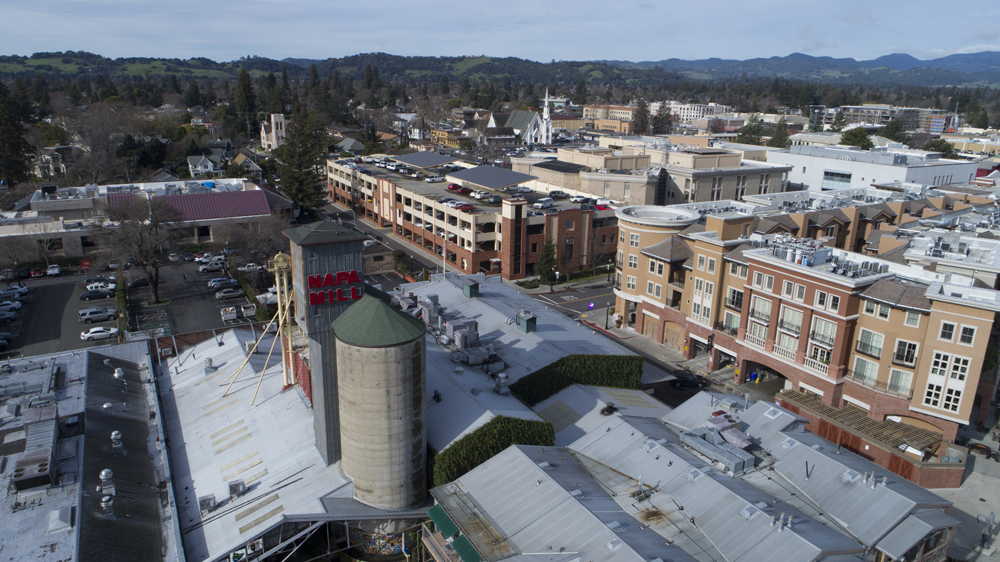
The Bay Area is becoming more familiar with express lanes as they become more widespread along Interstates 580 and 680, as well as state Route 237. Express lanes are carpool lanes that also give solo drivers the choice to pay a toll for a more reliable trip.
Carpools and buses can still use the lanes free of charge. Express lanes are a high-tech way to take advantage of available capacity in under-used carpool lanes and to improve traffic management and reliability on well-utilized carpool lanes.
With toll revenue, express lanes can offer enhanced enforcement to catch cheaters, access control to manage merging and weaving, and more cameras and sensors to quickly identify and respond to incidents. Plan Bay Area 2040 continues funding for completing the highest priority express lane segments. Most involve conversion of existing carpool lanes, while a smaller share would widen freeways to create new express lanes and to close gaps in the Bay Area’s existing carpool lane network.
Express lane toll revenue would first fund the operations and maintenance of the lanes. Plan Bay Area 2040 invests $450 million of discretionary revenue to complete the financing package for implementing the new express lanes.
Bay Area transportation agencies are developing a 550-mile network of Bay Area Express Lanes that will be completed in 2035.
Credit: Noah Berger
Plan Bay Area 2040 is the Bay Area’s first regional plan with dedicated discretionary revenue allocated toward goods movement to implement the recommendations of the Regional Goods Movement Plan. This investment strategy includes significant funding for increasing efficiency at the Port of Oakland by reducing rail-truck conflicts and improving bottlenecks at interchanges along the truck freight network.
Additionally, the investment strategy carves out $350 million for a clean fuel and impact-reduction program, which was a major element of the Regional Goods Movement Plan.
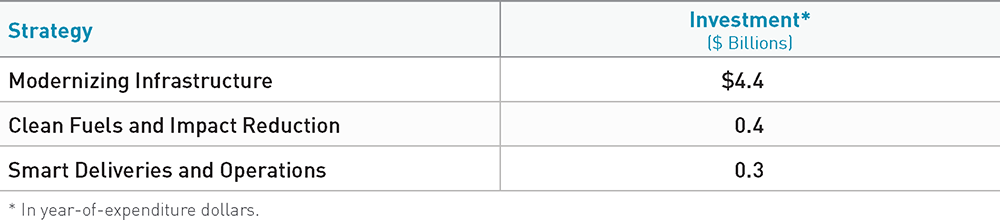
Key strategies include:
Modernizing Infrastructure: Projects to improve operations and increase rail access at the Port of Oakland, including 7th Street Grade Separation, Outer Harbor Intermodal Terminal and Oakland Army Base transportation components; highway projects and interchange improvements along freight corridors such as I-880, I-80, U.S. 101, I-580, I-680, and state Route 4.
Clean Fuels and Impact Reduction: Future program for implementing the recommendations of the Freight Emissions Reduction Action Plan and developing programs for environmental and community impact reduction in neighborhoods with high levels of freight activity.
Smart Deliveries and Operations: Future program for deploying communications infrastructure to increase active traffic management along freight corridors and to/from the Port of Oakland.
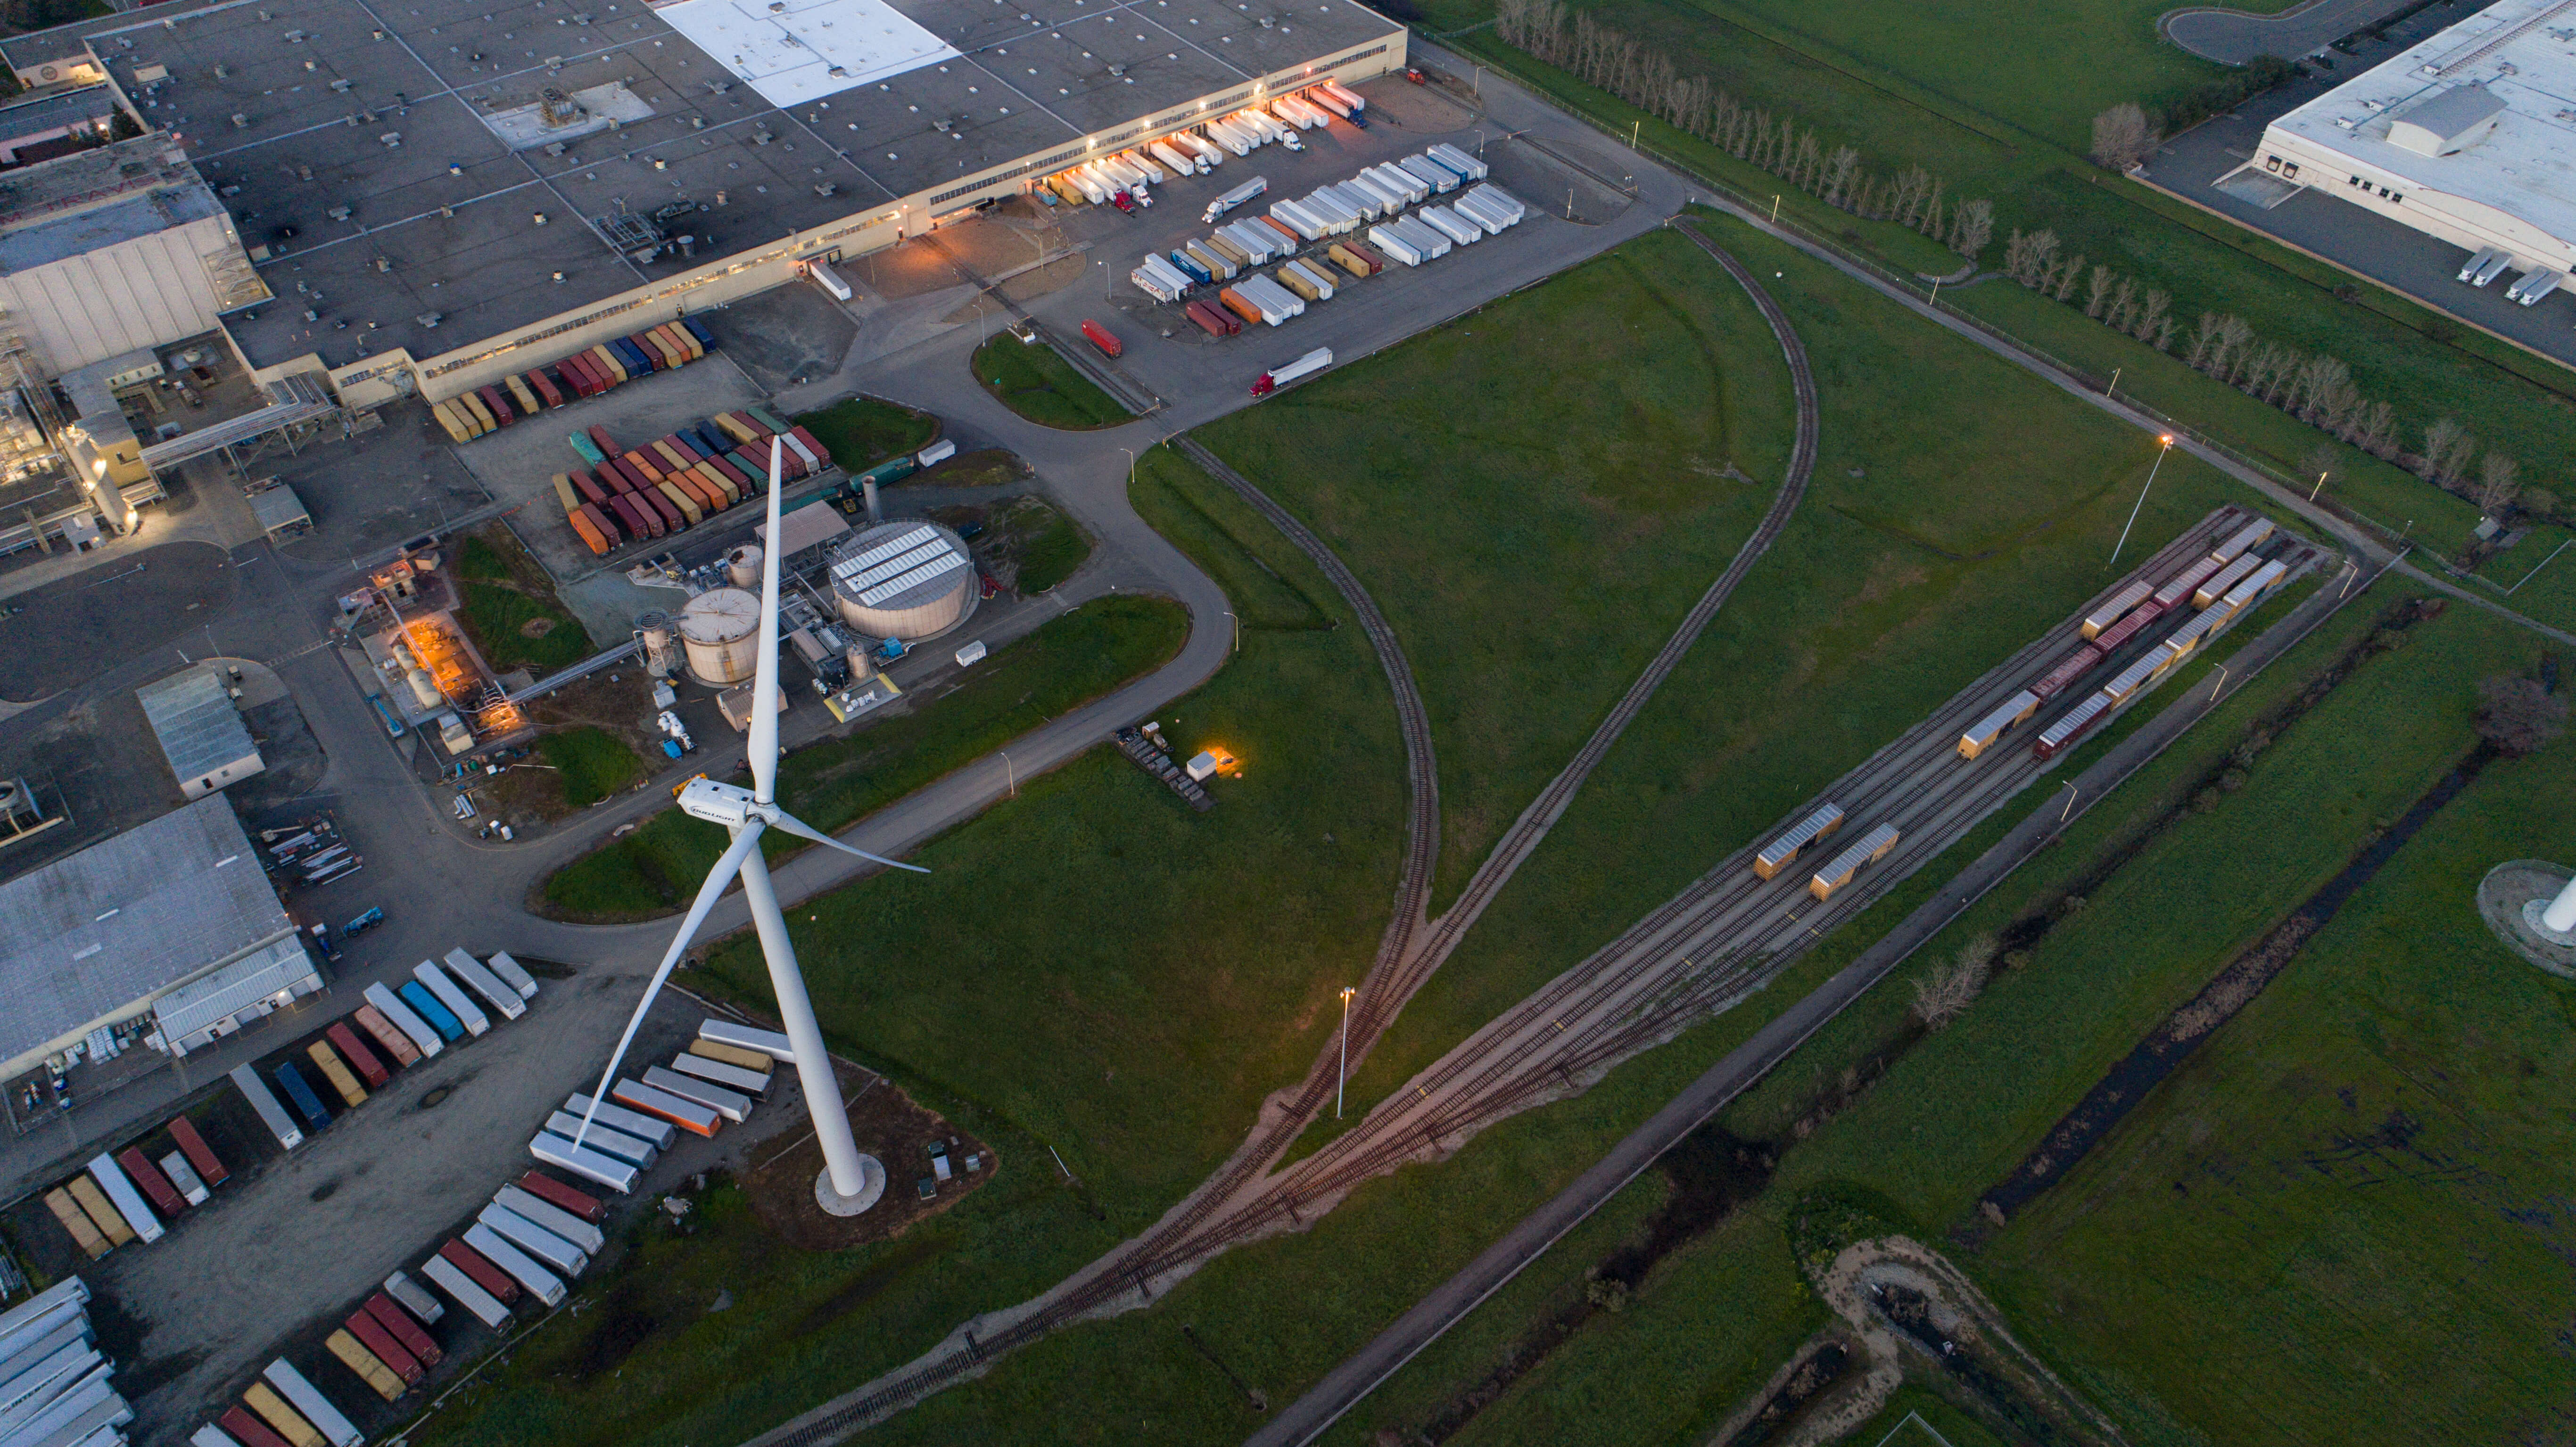
A freight yard in Fairfield, Solano County.
Credit: Karl Nielsen
TABLE 4.7 Plan Bay Area 2040 goods movement investments.
Source: Metropolitan Transportation Commission, 2016
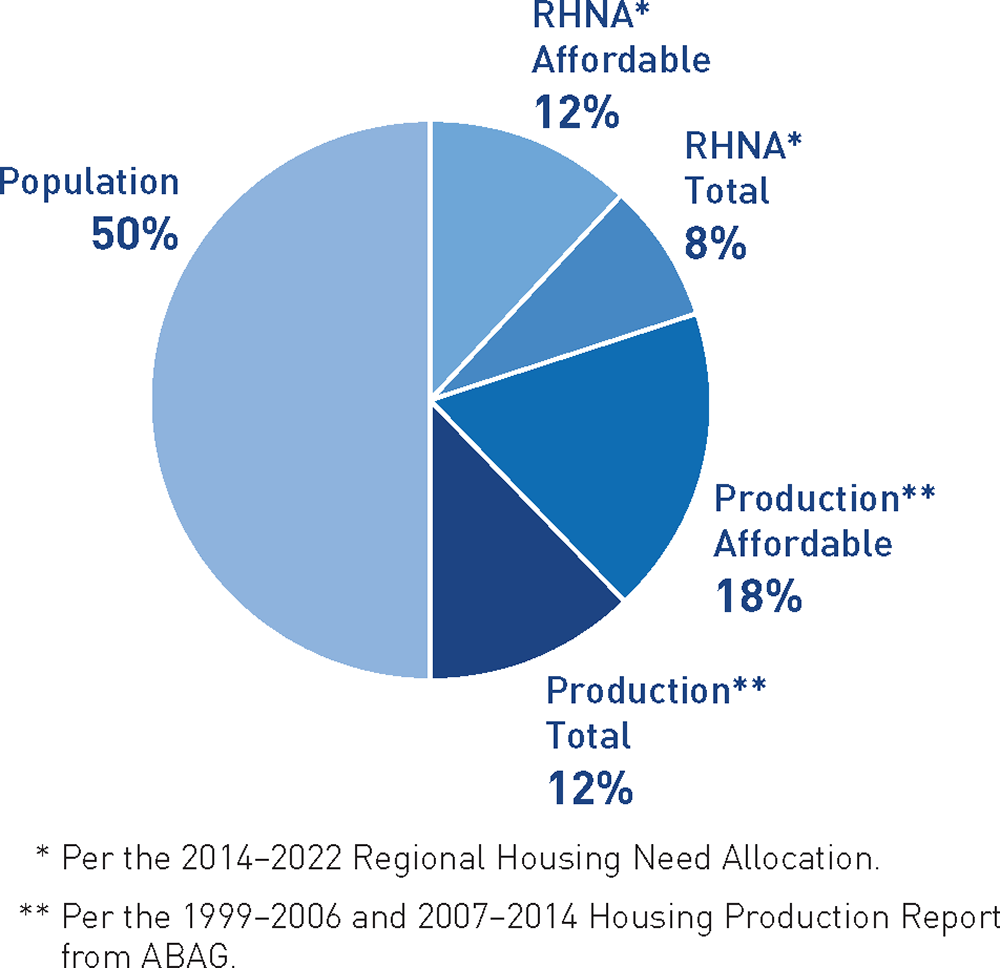
FIGURE 4.2 Distribution formula for OBAG 2 County Program.
The five-year, $916 million One Bay Area Grant (OBAG 2) program is the second cycle of funding integrating the Bay Area’s federal transportation program with California’s climate laws and the regional Sustainable Communities Strategy. OBAG 2 will
fund projects from 2017–18 through 2021–22 and will support local transportation, housing, land use and environmental goals. OBAG 2 is divided into a County Program and a Regional Program. County Program funds are distributed based on factors such as
population, past housing production and future housing commitments.
Source: Metropolitan Transportation Commission, 2016
FIGURE 4.3 Project selection results for the OBAG 1 program.
The inaugural One Bay Area Grant (OBAG 1) program was adopted by MTC in 2012 to guide $818 million in federal funds over the five-year period from 2012–13 through 2016–17. Figure 4.3 provides a breakdown of all the funding programmed during the grant
cycle. As can be seen, OBAG funds supported a variety of regional needs such as transit (including Clipper), highways and roadways, Safe Routes to School, and bicycle and pedestrian planning, as well as planning activities, climate initiatives and
conservation.
Source: Metropolitan Transportation Commission, 2016
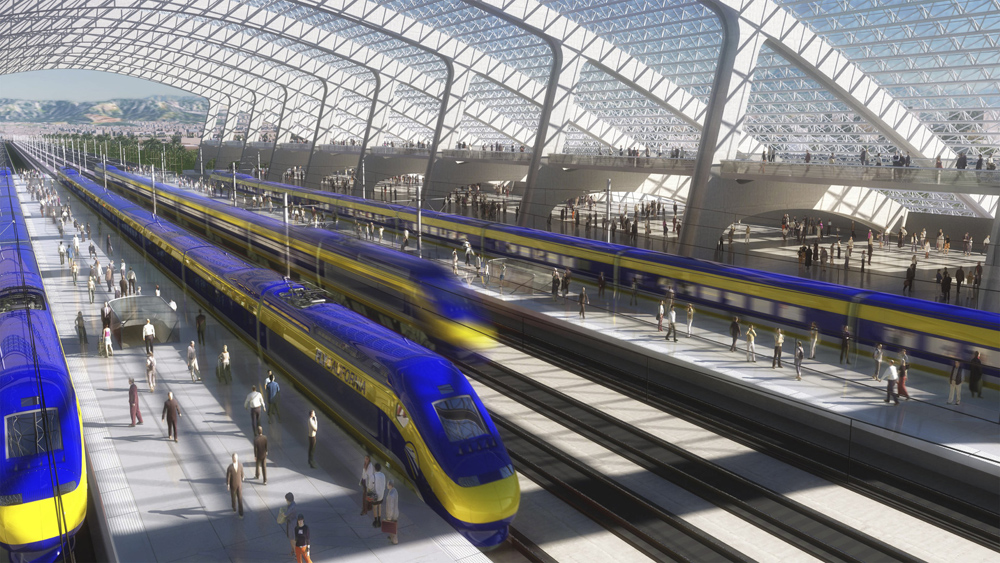
High-speed rail will provide faster connections between the Bay Area, the Central Valley and Southern California.
Credit: Public Domain, from the California High-Speed Rail Authority
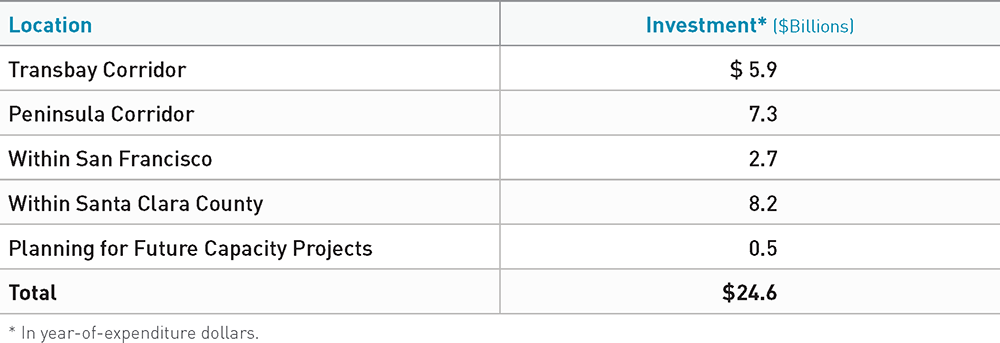
TABLE 4.8 Plan Bay Area 2040 core capacity projects.
Source: Metropolitan Transportation Commission, 2016
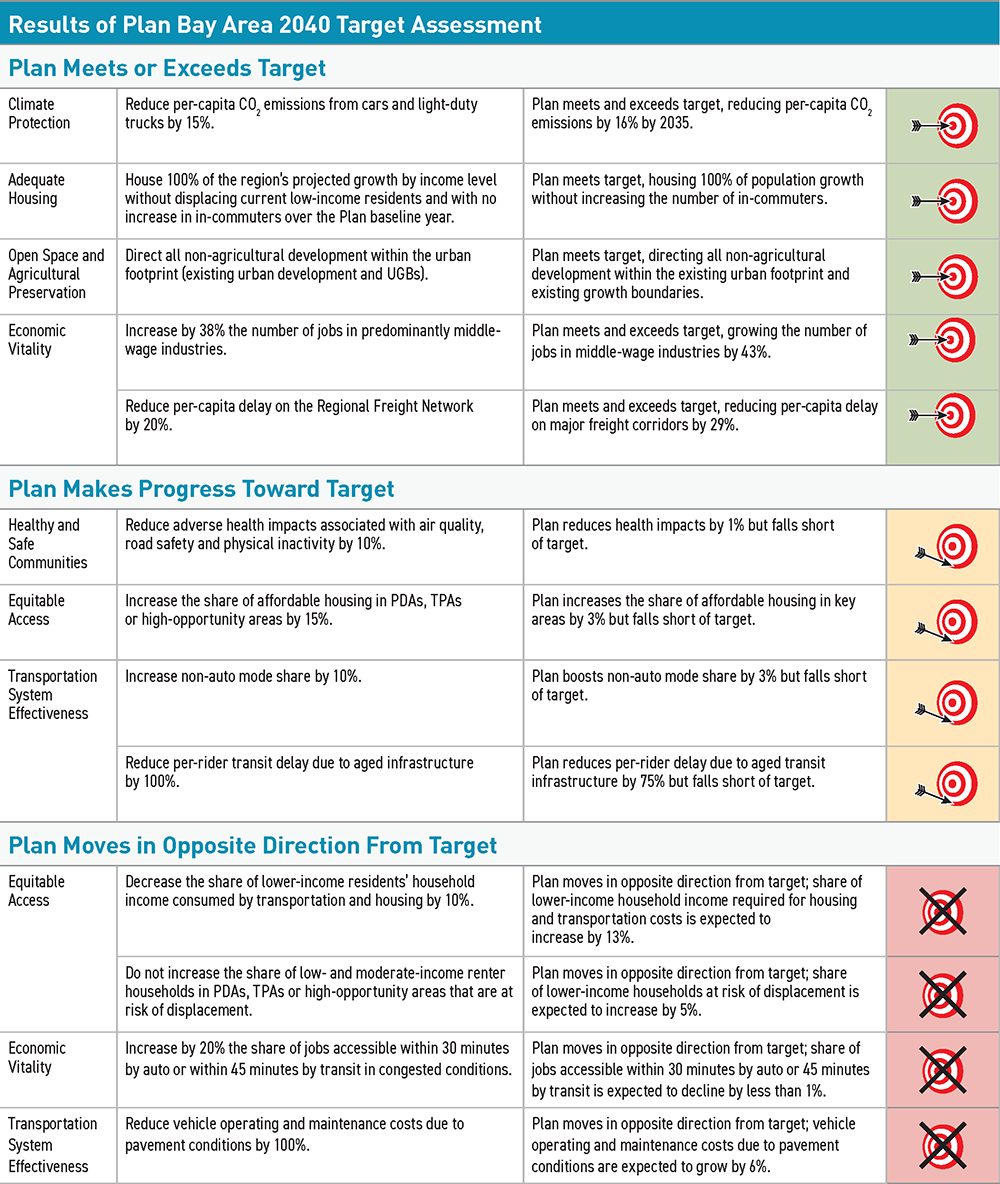
TABLE 4.9 Results of Plan Bay Area 2040 target assessment.
Source: Metropolitan Transportation Commission, 2016
TABLE 4.10 Ranking of Plan Bay Area 2040 performance against targets.
Source: Metropolitan Transportation Commission, 2016


