Plan Bay Area 2040 Final Plan
Final Plan Bay Area 2040
 go to previous page
go to next page
go to previous page
go to next page

The iconic Golden Gate Bridge and beautiful beaches make the Bay Area one of the world’s most popular regions to visit and call home.
Credit: Unsplash, Creative Commons CC0 Public Domain license
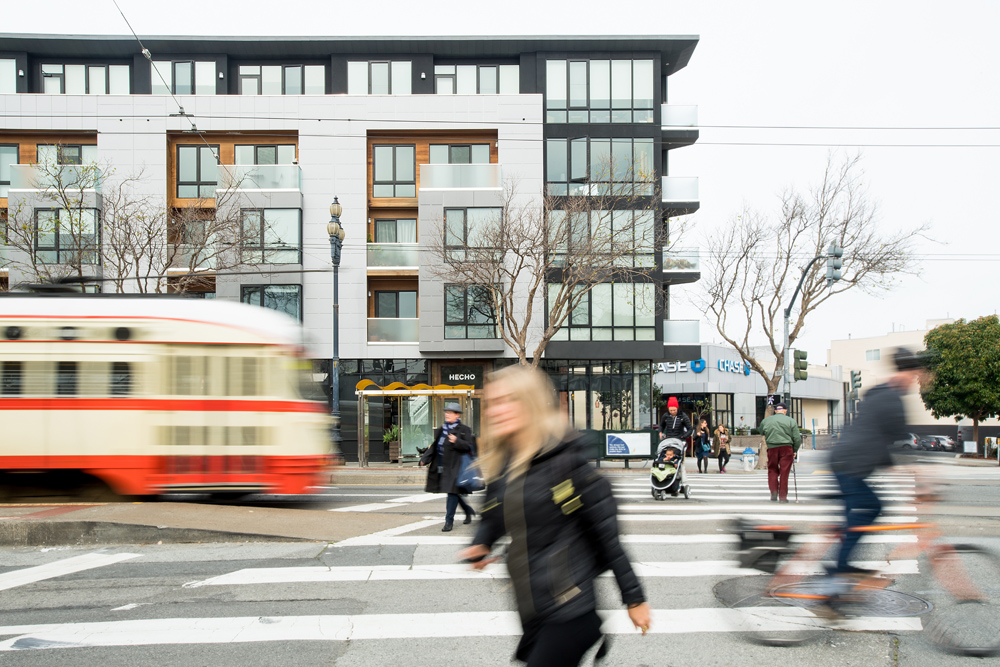
Biking and walking are popular methods of transportation for San Francisco residents.
Credit: Noah Berger

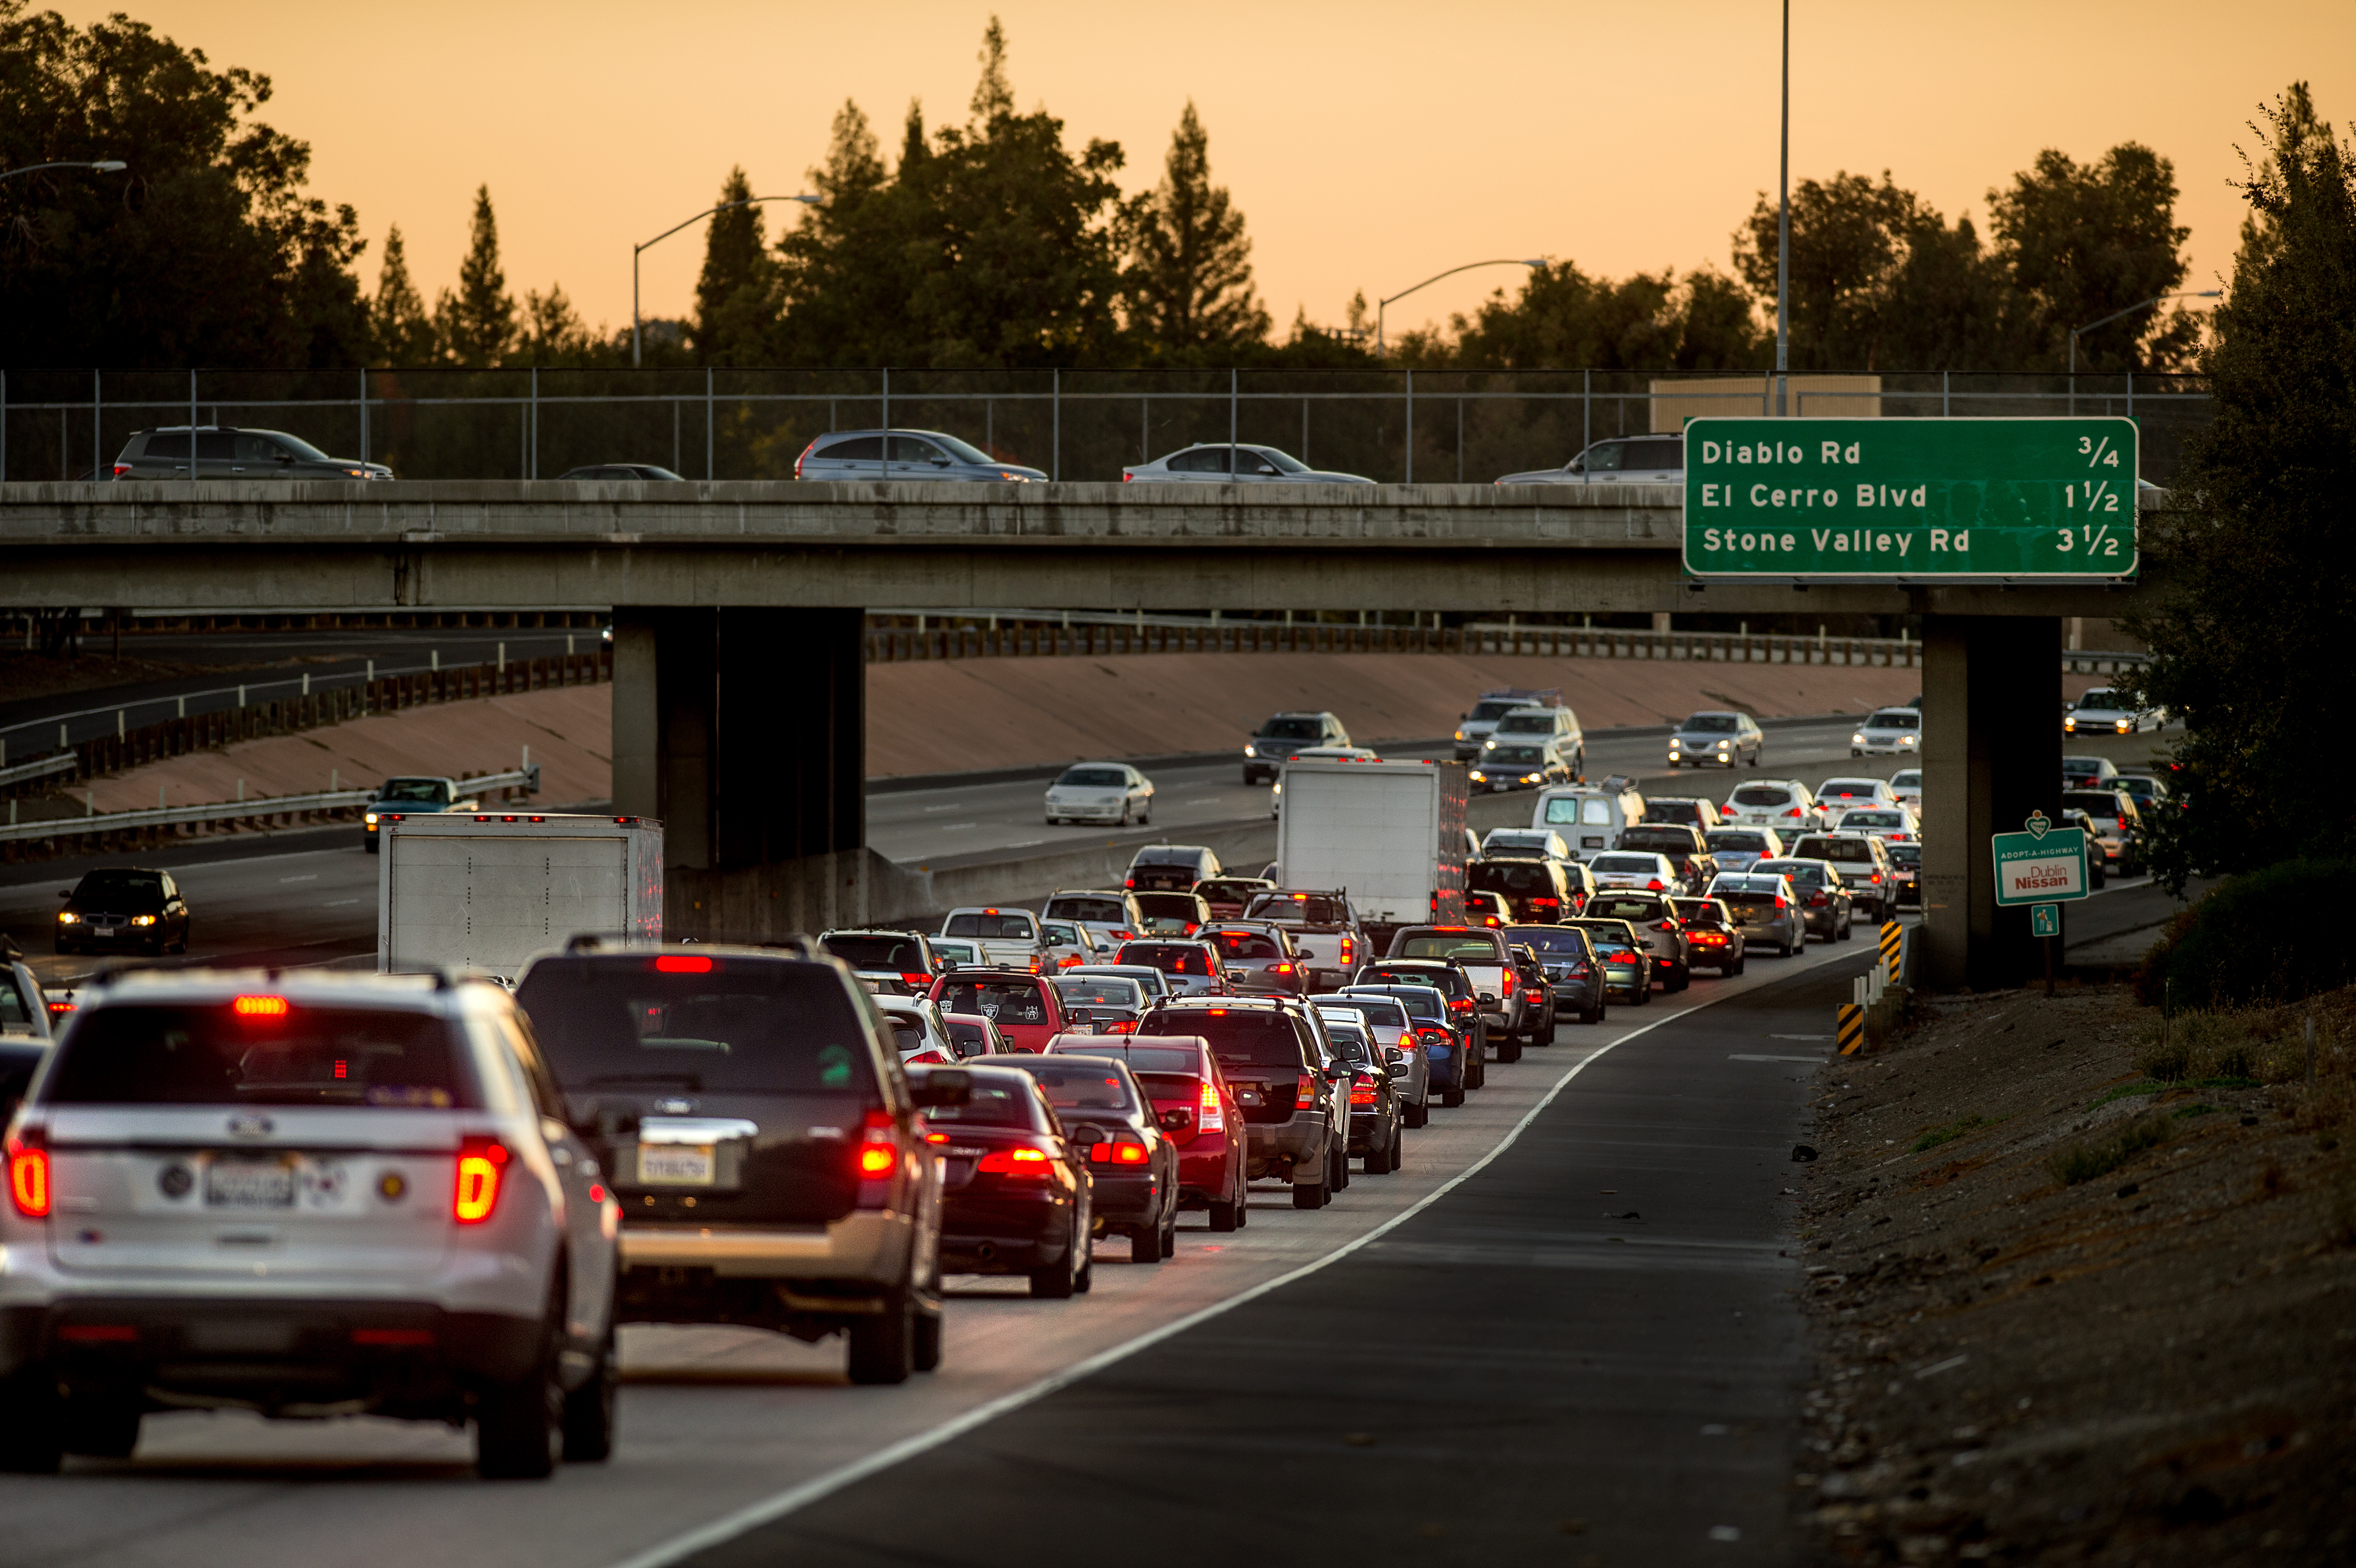
A booming regional economy has led to record congestion on the Bay Area's freeways.
Credit: Noah Berger
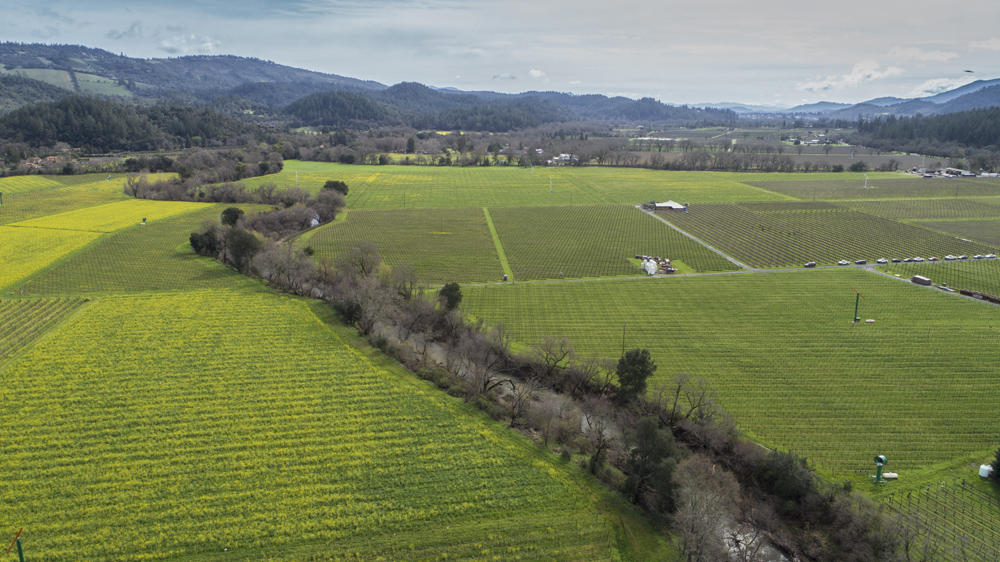
Napa County has a reputation as a premier wine-producing region.
Credit: Karl Nielsen
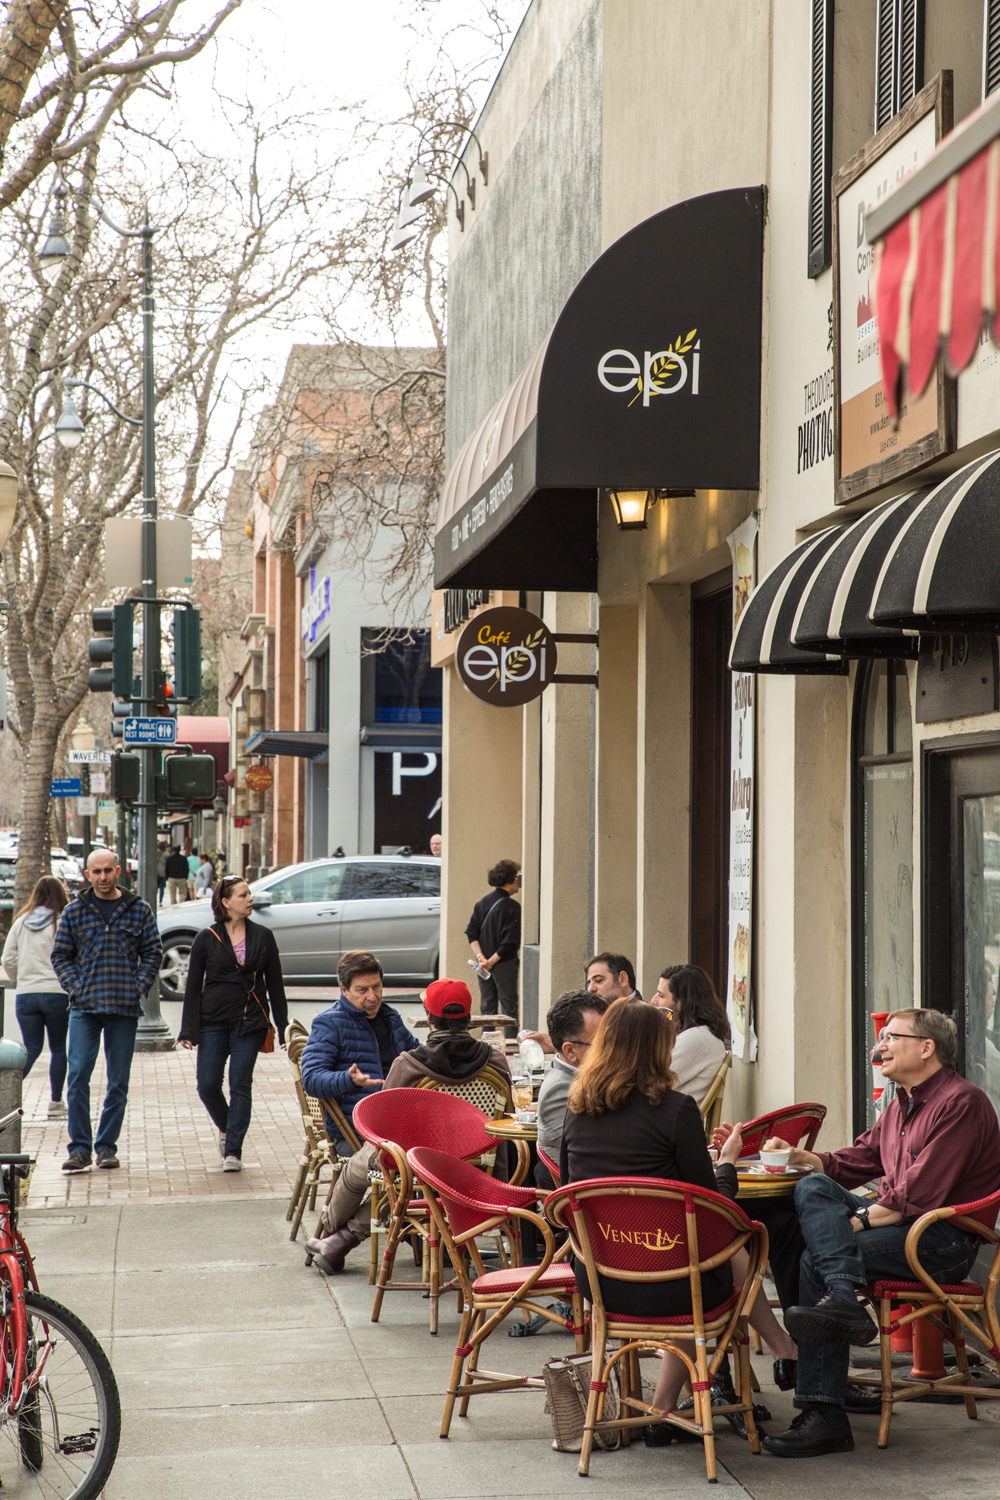
The retail economy is growing in Palo Alto.
Credit: Martin Klimek
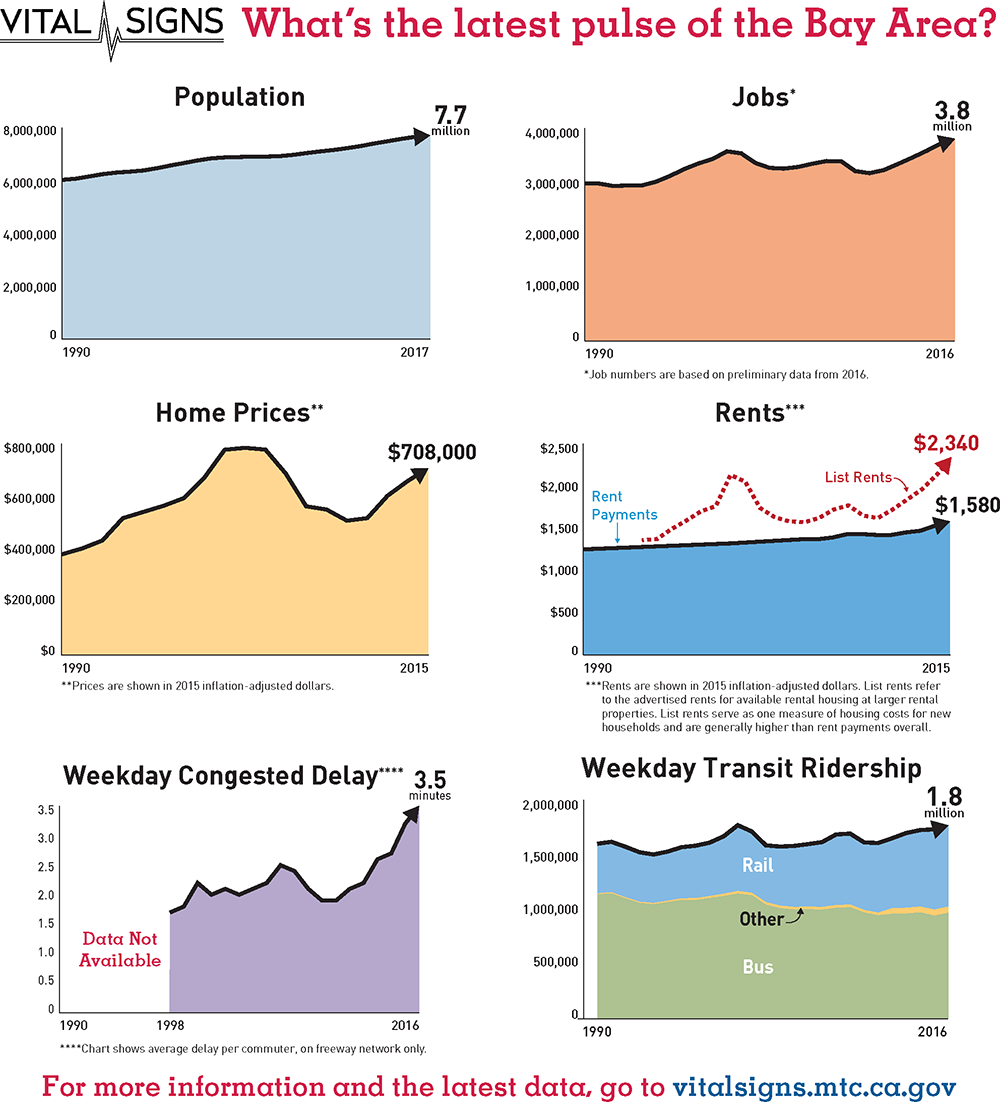
FIGURE 1.1 A snapshot of the Bay Area’s “Vital Signs.”
For 25 years the Bay Area has seen steady population growth coupled with “boom-and-bust” jobs cycles. Population and employment are now at their highest levels ever. Over this time home prices and list rents have fluctuated significantly and are now
at or near record levels. Freeway congestion delay per commuter and weekday rail ridership are also currently at record levels.
Source: Vital Signs; U.S. Census Bureau, 1990–2017; California Employment Development Department, 1990–2016; Zillow, 1997–2015; U.S. Census Bureau/American Community Survey, 1990–2015; realAnswers, 1994–2015; Metropolitan Transportation Commission,
1998–2017; Federal Transit Administration, 1991–2016
FIGURE 1.2 The historical trend for annual permitted housing units in the Bay Area.
This graph shows the historical trend of permitted units for both single-family and multi-family units in the Bay Area, stretching back several decades. As can be seen, annual growth in permitted units stagnated even during the employment booms of
the 1990s and 2010s.
Source: Vital Signs; Construction Industry Research Board, 1967–2010; California Homebuilding Foundation/Construction Industry Research Board, 2011–2015
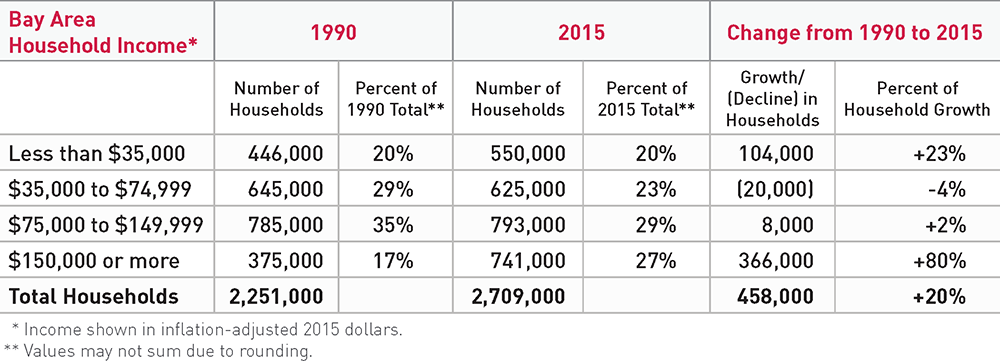
TABLE 1.1 A comparison of the number of households by income level in the Bay Area over a 25-year period from 1990 to 2015.
From 1990 to 2015, households earning more than $150,000 a year have greatly increased their share of the total number of households in the region and comprised a vast majority of the regional growth in households over the same period. As a share of
total households, those earning between $35,000 and $149,999 have declined significantly and in absolute numbers have either stagnated or decreased.
Source: U.S. Census Bureau, 1990; U.S. Census Bureau/American Community Survey, 2015 (Social Explorer)

The Bay Area faces a severe housing crisis.
Credit: MTC Archives

Affordable and low-income housing options are in short supply in the Bay Area.
Credit: MTC Archives
The dissolution of redevelopment agencies in California eliminated a major source of funding for affordable housing.
Credit: Henri Sivonen, Creative Commons Attribution 2.0 Generic license
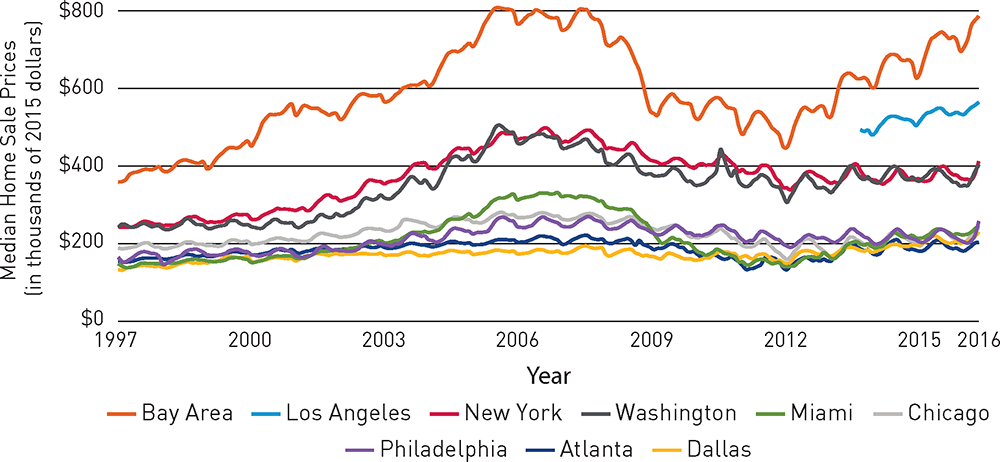
FIGURE 1.3 Median home sale prices by metro area from 1997 to 2016.
Over the last 20 years the Bay Area has seen one of the “spikiest” real estate markets in the country, with bigger booms and busts than other large metros. In particular, prices have risen much faster in the Bay Area coming out of the recent Great
Recession.
Source: Vital Signs; Zillow, 1997–2016
FIGURE 1.4 Share of income spent on housing by Bay Area households in 2015, segmented by income level.
A significant majority of households earning less than $35,000 in the Bay Area spent more than 50 percent of their household income on housing in 2015.
Source: Vital Signs; U.S. Census Bureau/American Community Survey, 2015
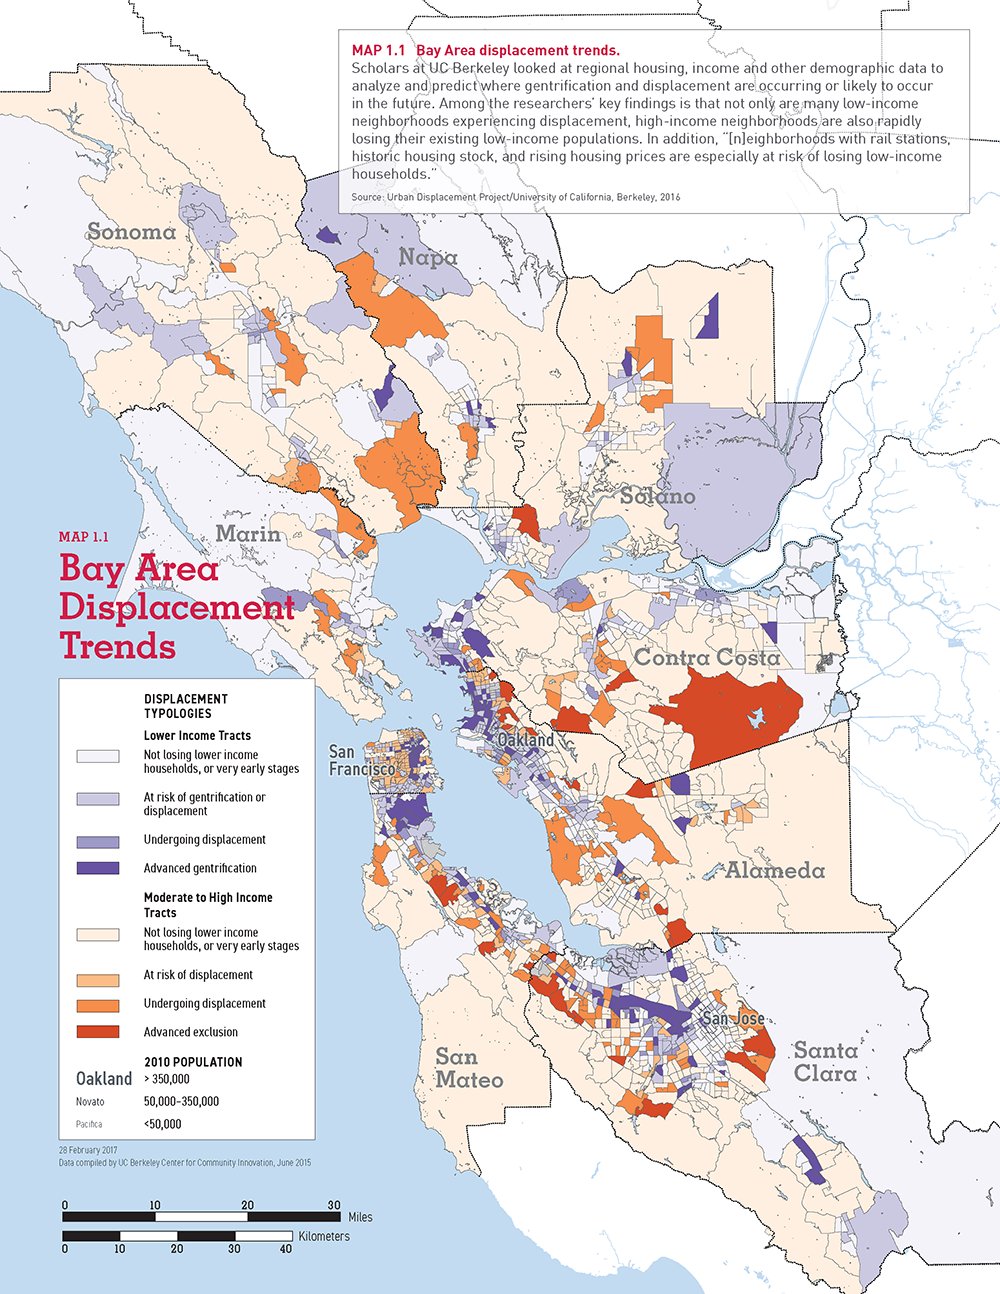
MAP 1.1 Bay Area displacement trends.
Scholars at UC Berkeley looked at regional housing, income and other demographic data to analyze and predict where gentrification and displacement are occurring or likely to occur in the future. Among the researchers’ key findings is that not only
are many low-income neighborhoods experiencing displacement, high-income neighborhoods are also rapidly losing their existing low-income populations. In addition, “[n]eighborhoods with rail stations, historic housing stock, and rising housing prices
are especially at risk of losing low-income households.”
Source: Urban Displacement Project/University of California, Berkeley, 2016
Traffic congestion is a major contributor to greenhouse gases.
Credit: MTC Archives
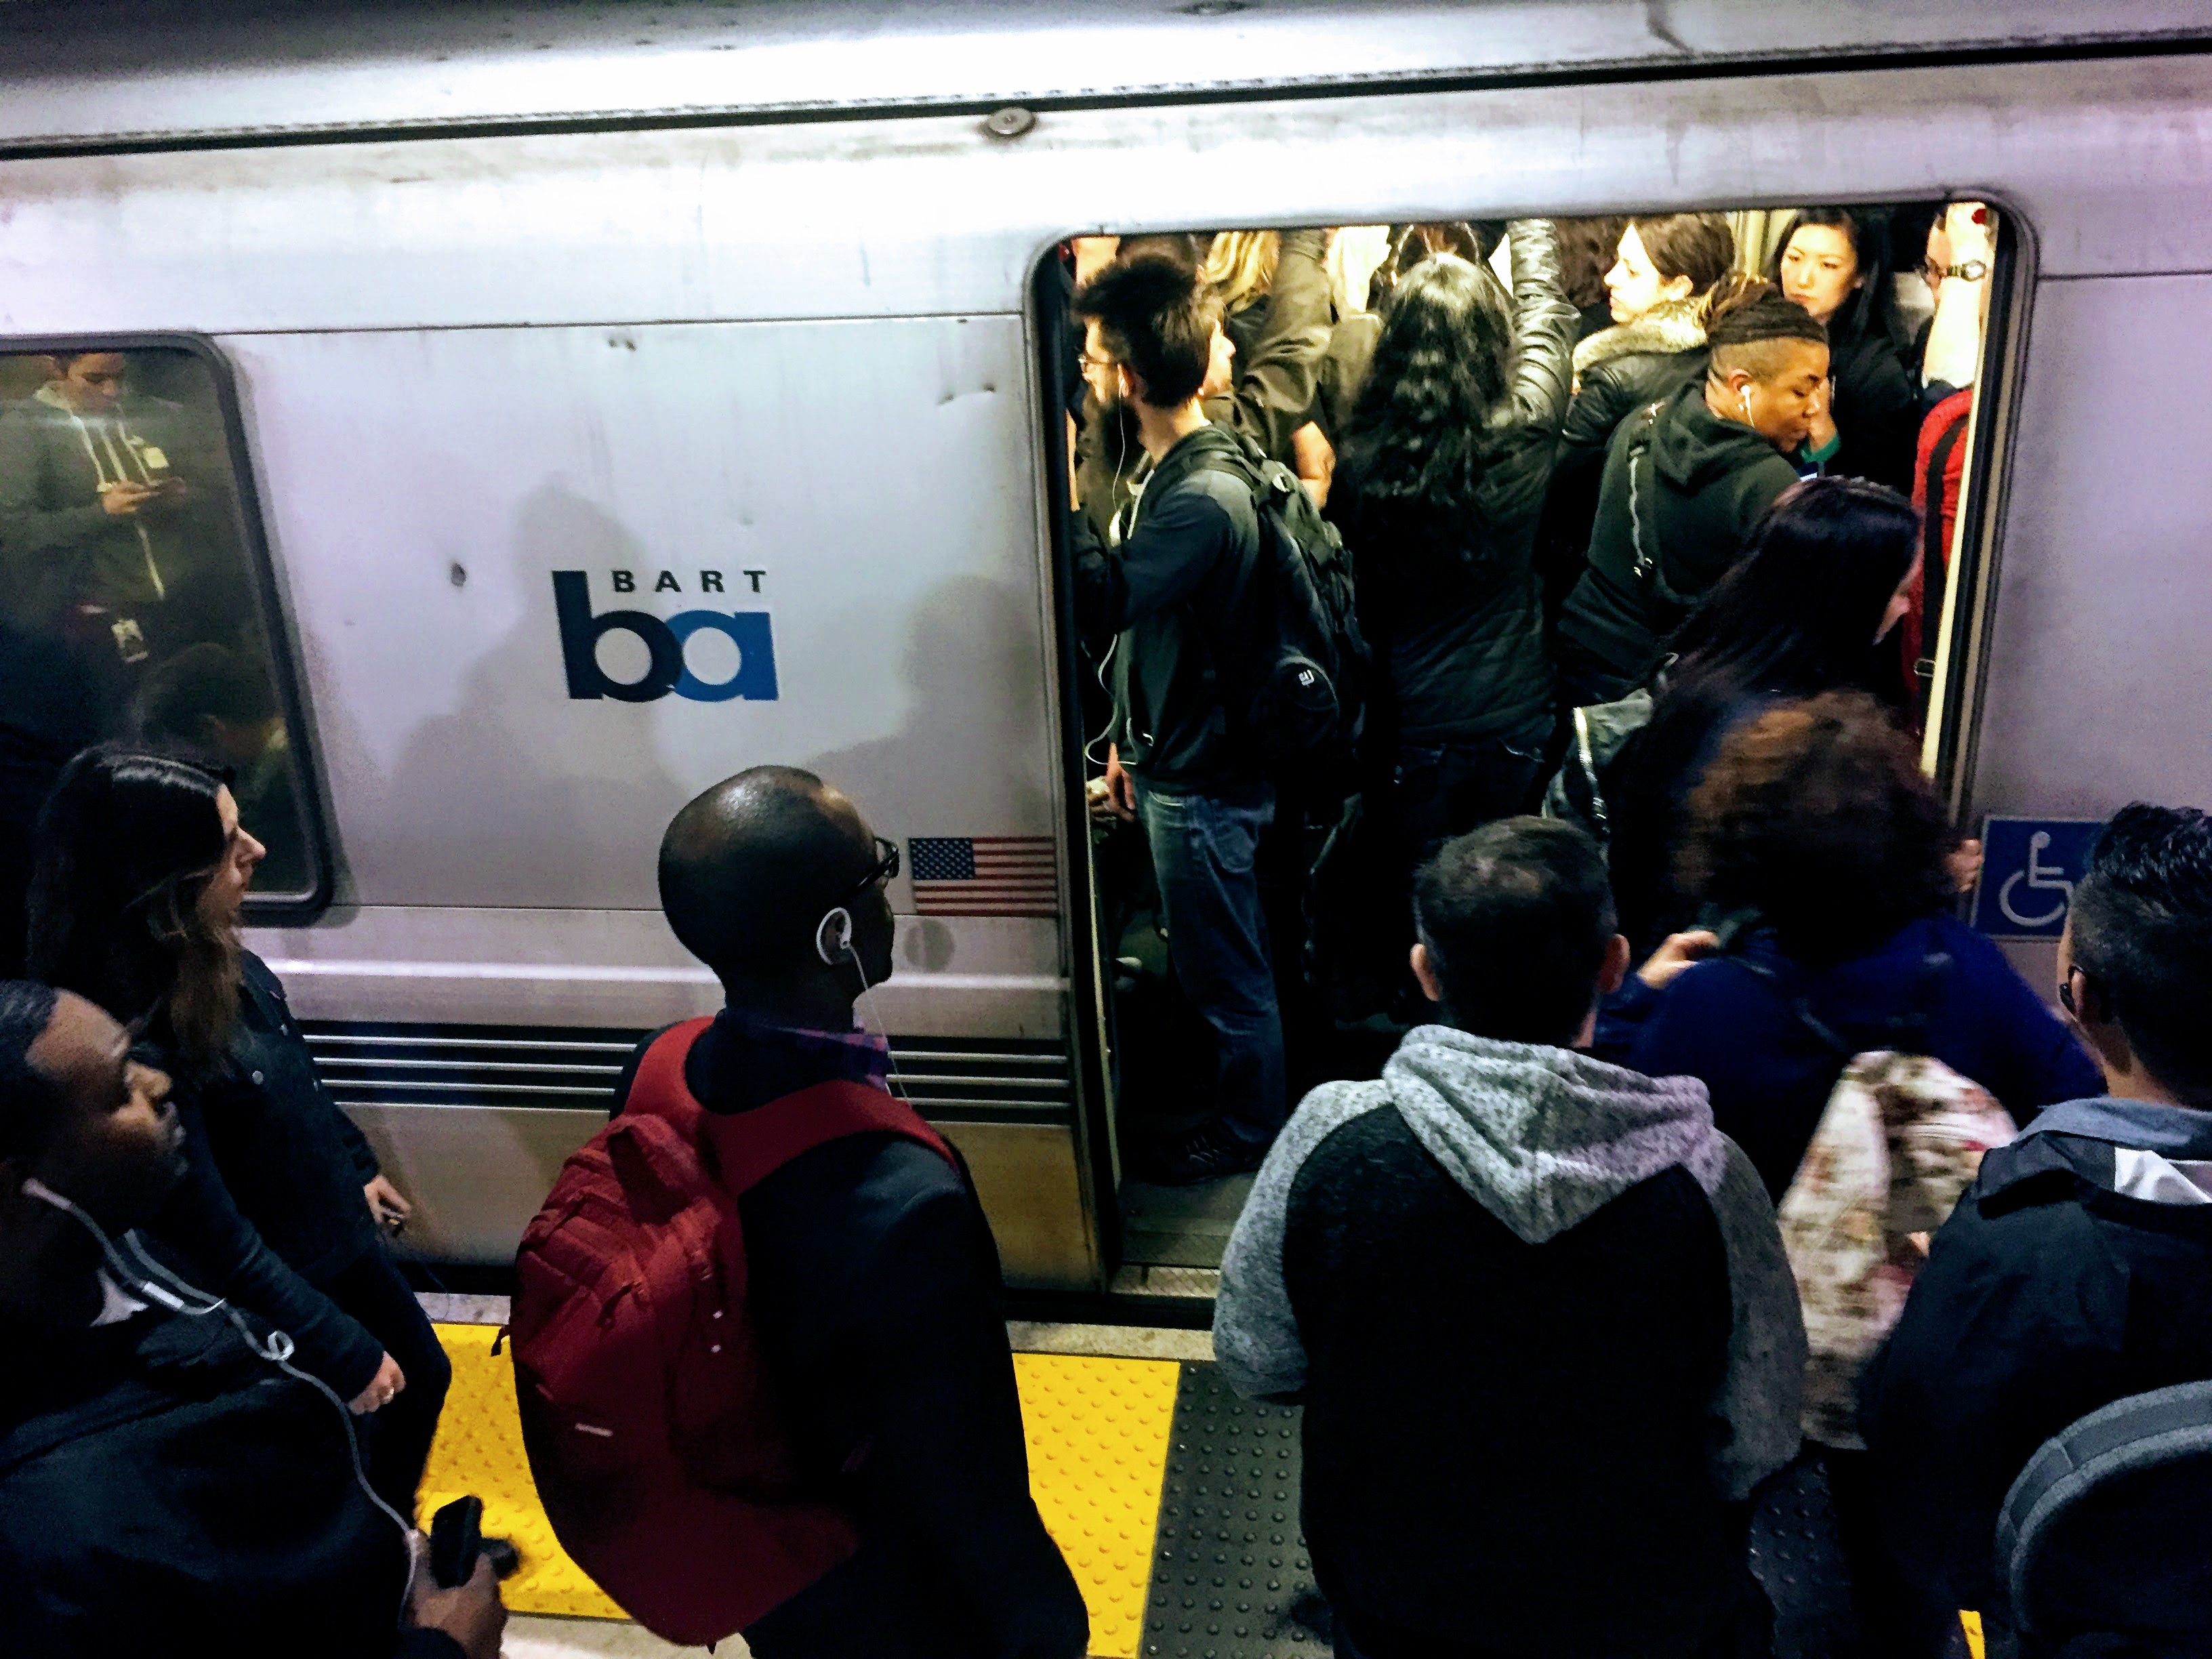
Peak direction, rush-hour trains on BART regularly exceed 100 percent capacity.
Credit: MTC Archives
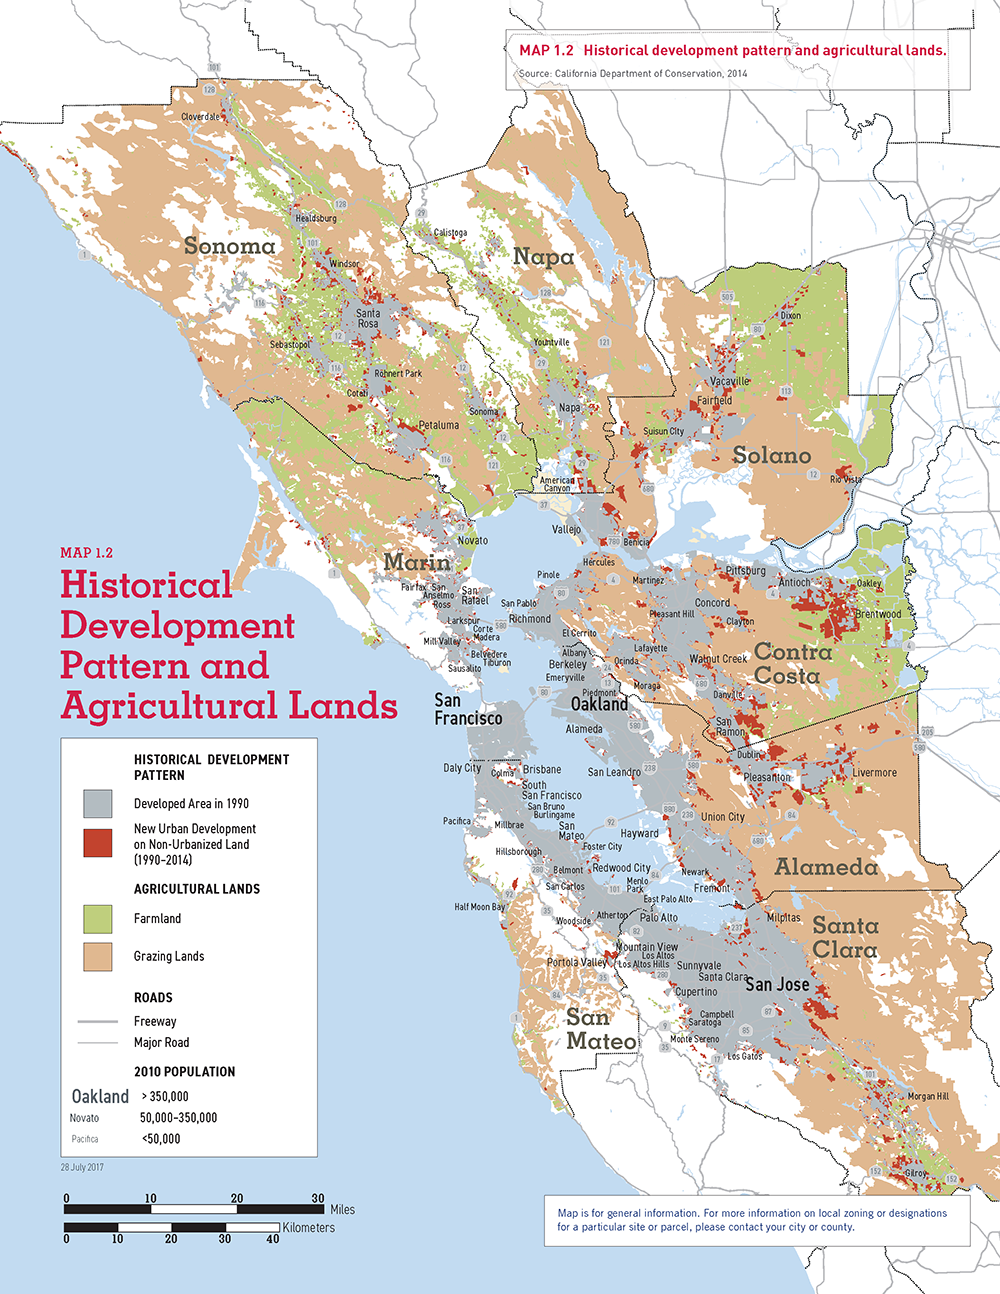
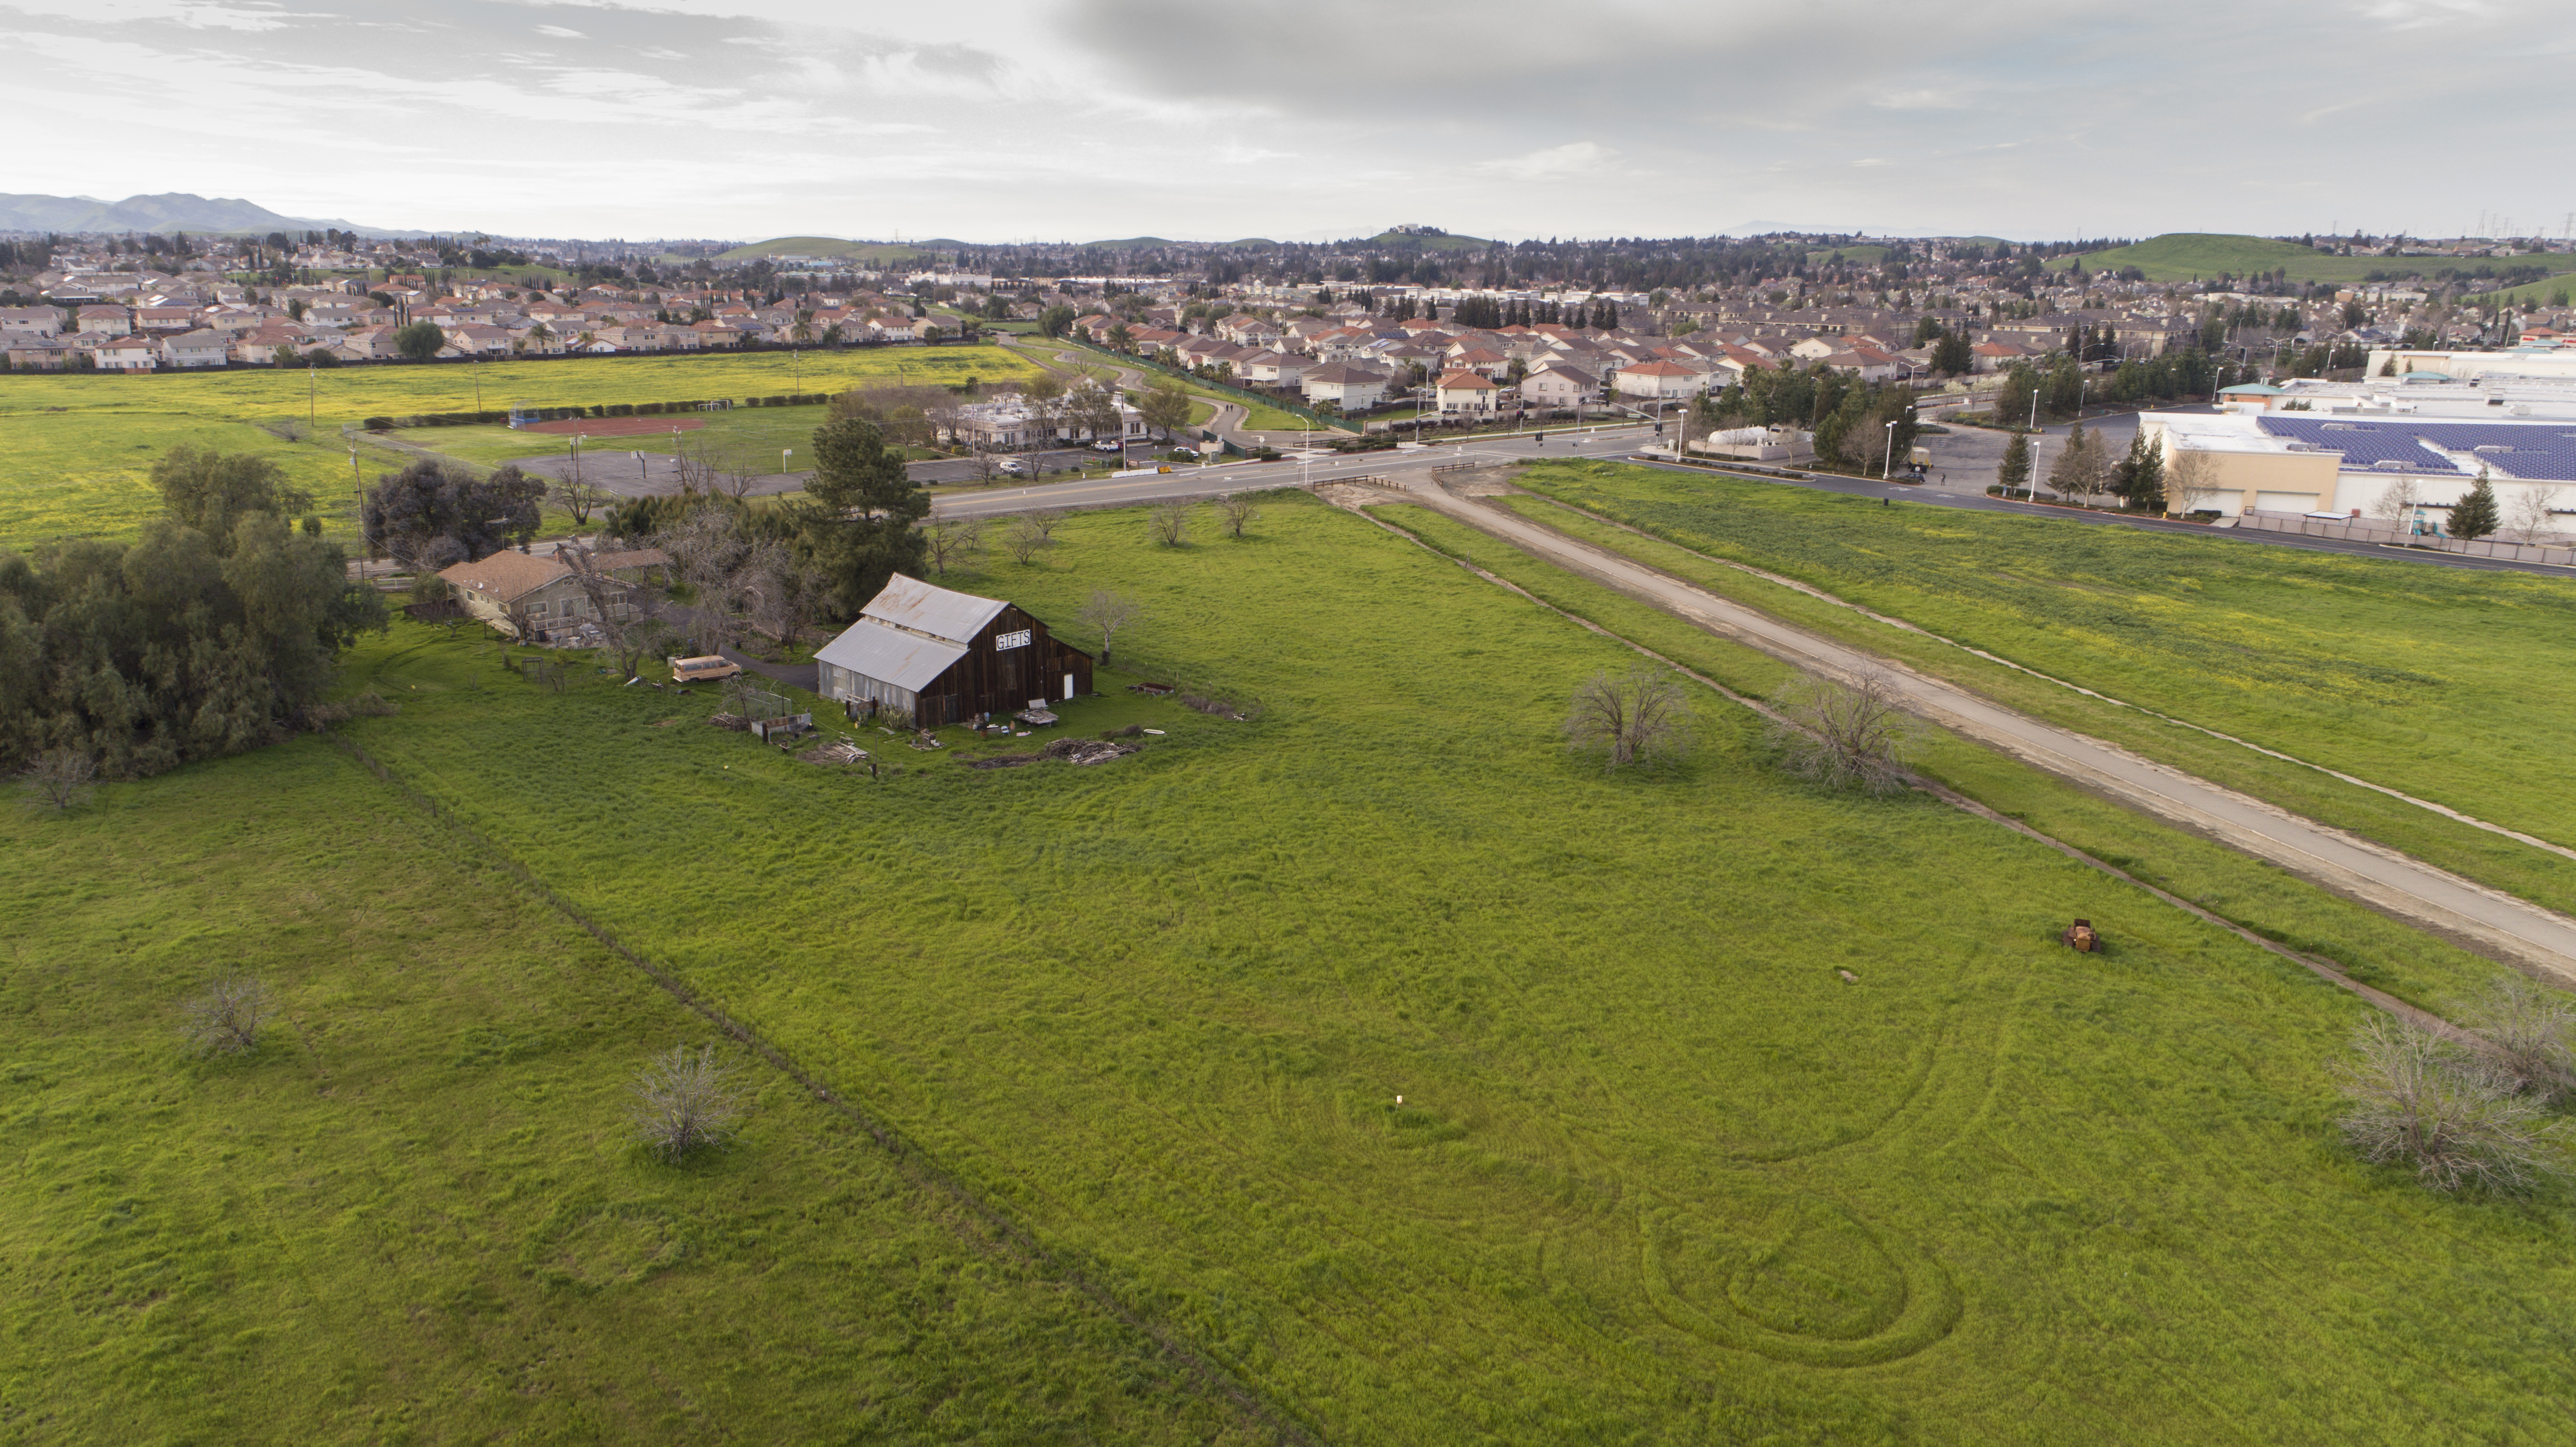
Agricultural land in Brentwood, Contra Costa County
Credit: Karl Nielsen
MAP 1.2 Historical Development Pattern and Agricultural Lands
Source: California Department of Conservation, 2014
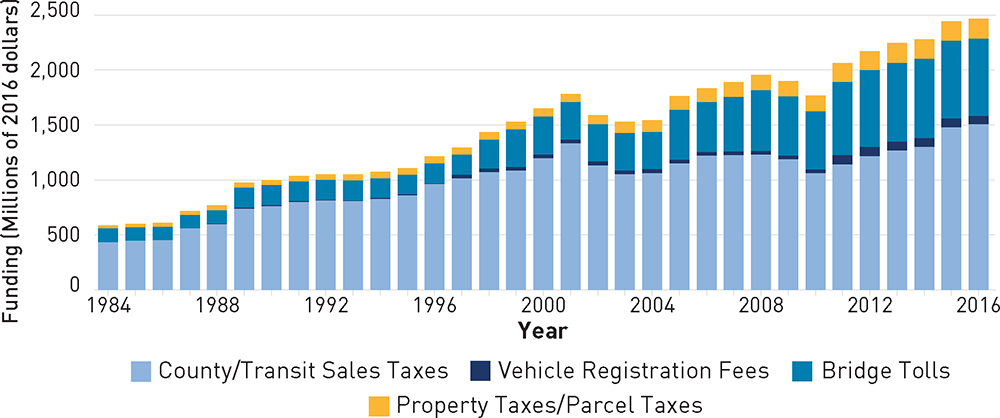
FIGURE 1.5 “Self-Help” funding for transportation in the Bay Area.
Bay Area voters have approved a variety of measures beyond transit operator revenues and the typical local, state and federal sources to help fund transportation needs.
Source: Metropolitan Transportation Commission, 2016
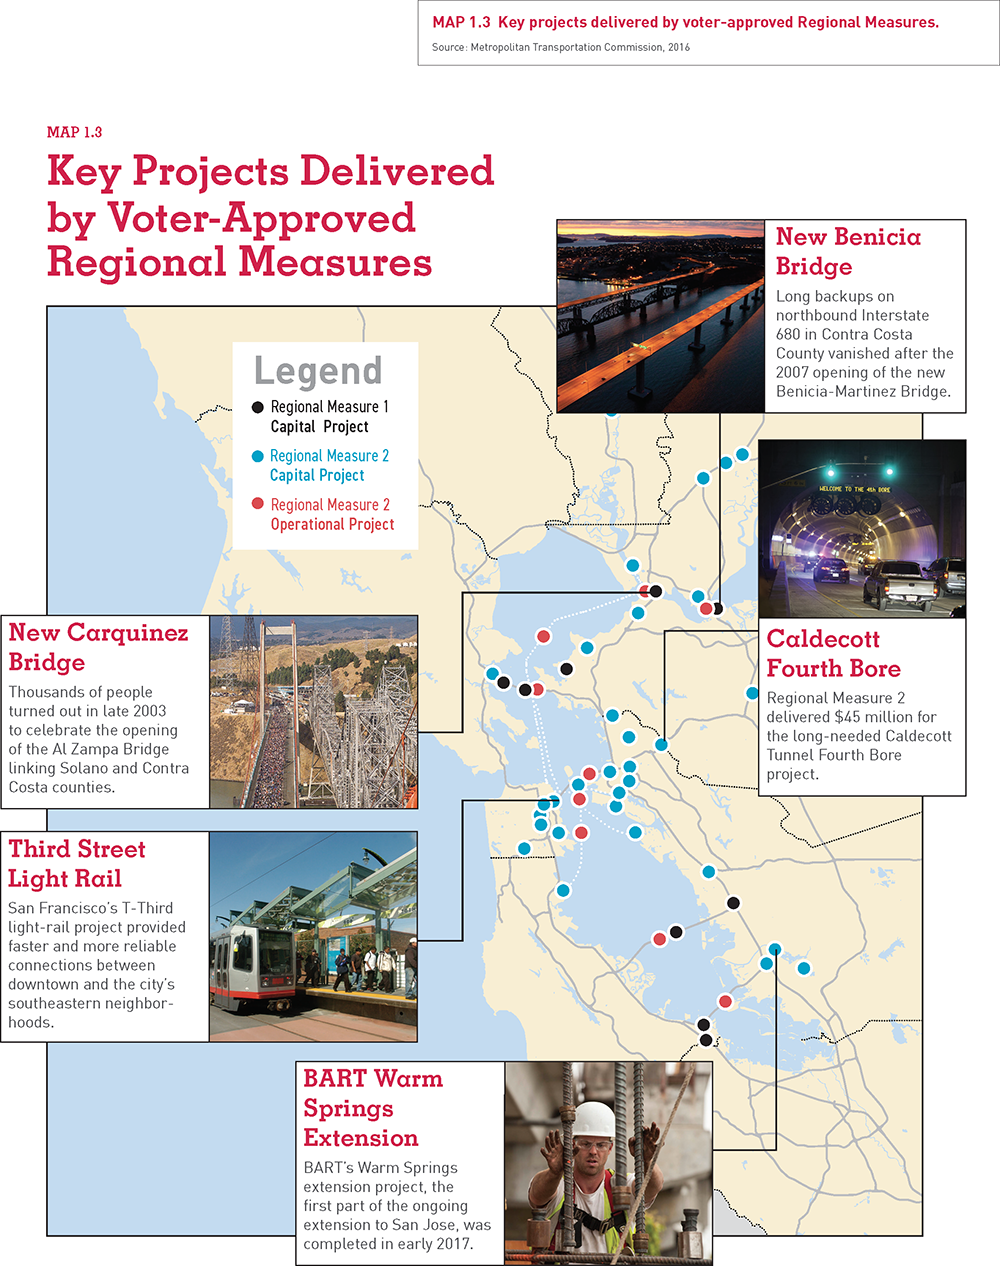
MAP 1.3 Key projects delivered by voter-approved Regional Measures.
Source: Metropolitan Transportation Commission, 2016
The region's future depends on sustainable solutions to the housing crisis.
Credit: MTC Archives


