Plan Bay Area 2040 Final Plan
Final Plan Bay Area 2040
 go to previous page
go to next page
The San Francisco Bay Area since the 1800s has drawn people from around the world seeking fortune, education, innovation, natural beauty and a near-perfect climate — and sometimes all of the above. Through cycles of boom and bust, the Bay Area has grown to be the fourth largest metropolitan region in the United States today, with over 7.7 million people residing in the nine-county, 7,000 square-mile area. In recent years, the Bay Area economy has experienced record employment levels during a tech expansion surpassing the “dot-com” era of the late 1990s.

The iconic Golden Gate Bridge and beautiful beaches make the Bay Area one of the world’s most popular regions to visit and call home.
Credit: Unsplash, Creative Commons CC0 Public Domain license
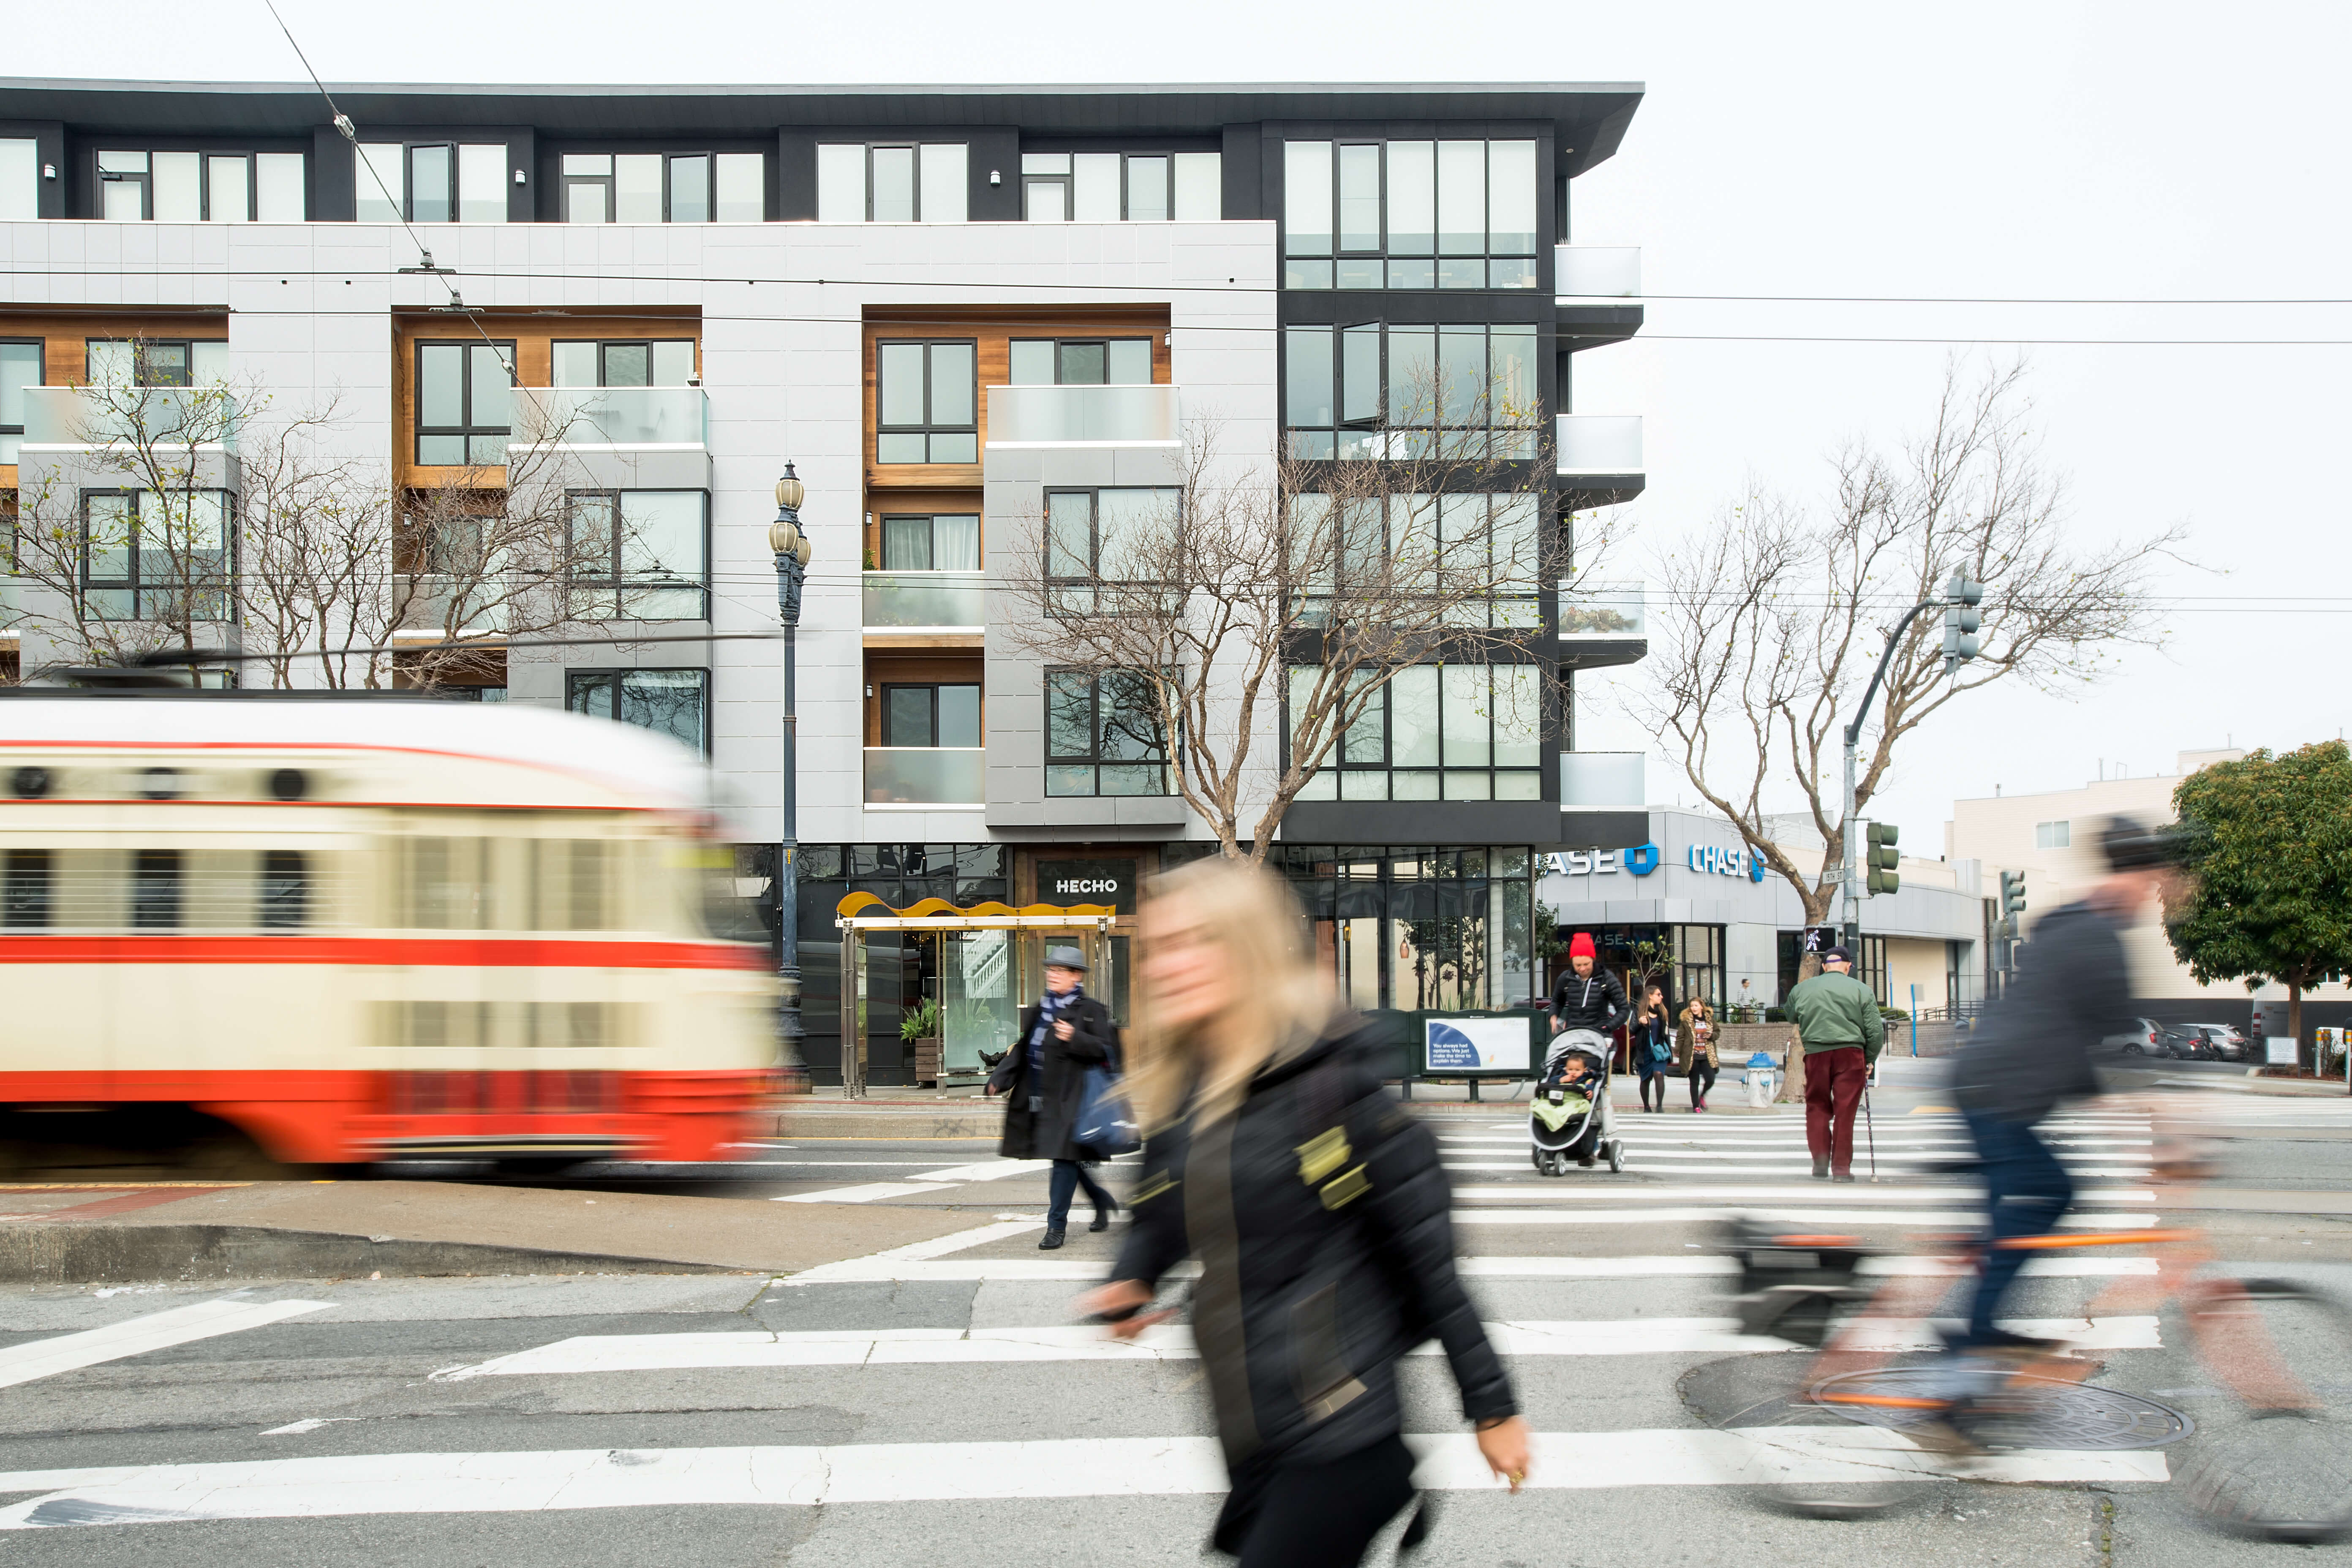
Biking and walking are popular methods of transportation for San Francisco residents.
Credit: Noah Berger

A booming regional economy has led to record congestion on the Bay Area's freeways.
Credit: Noah Berger
Napa County has a reputation as a premier wine-producing region.
Credit: Karl Nielsen
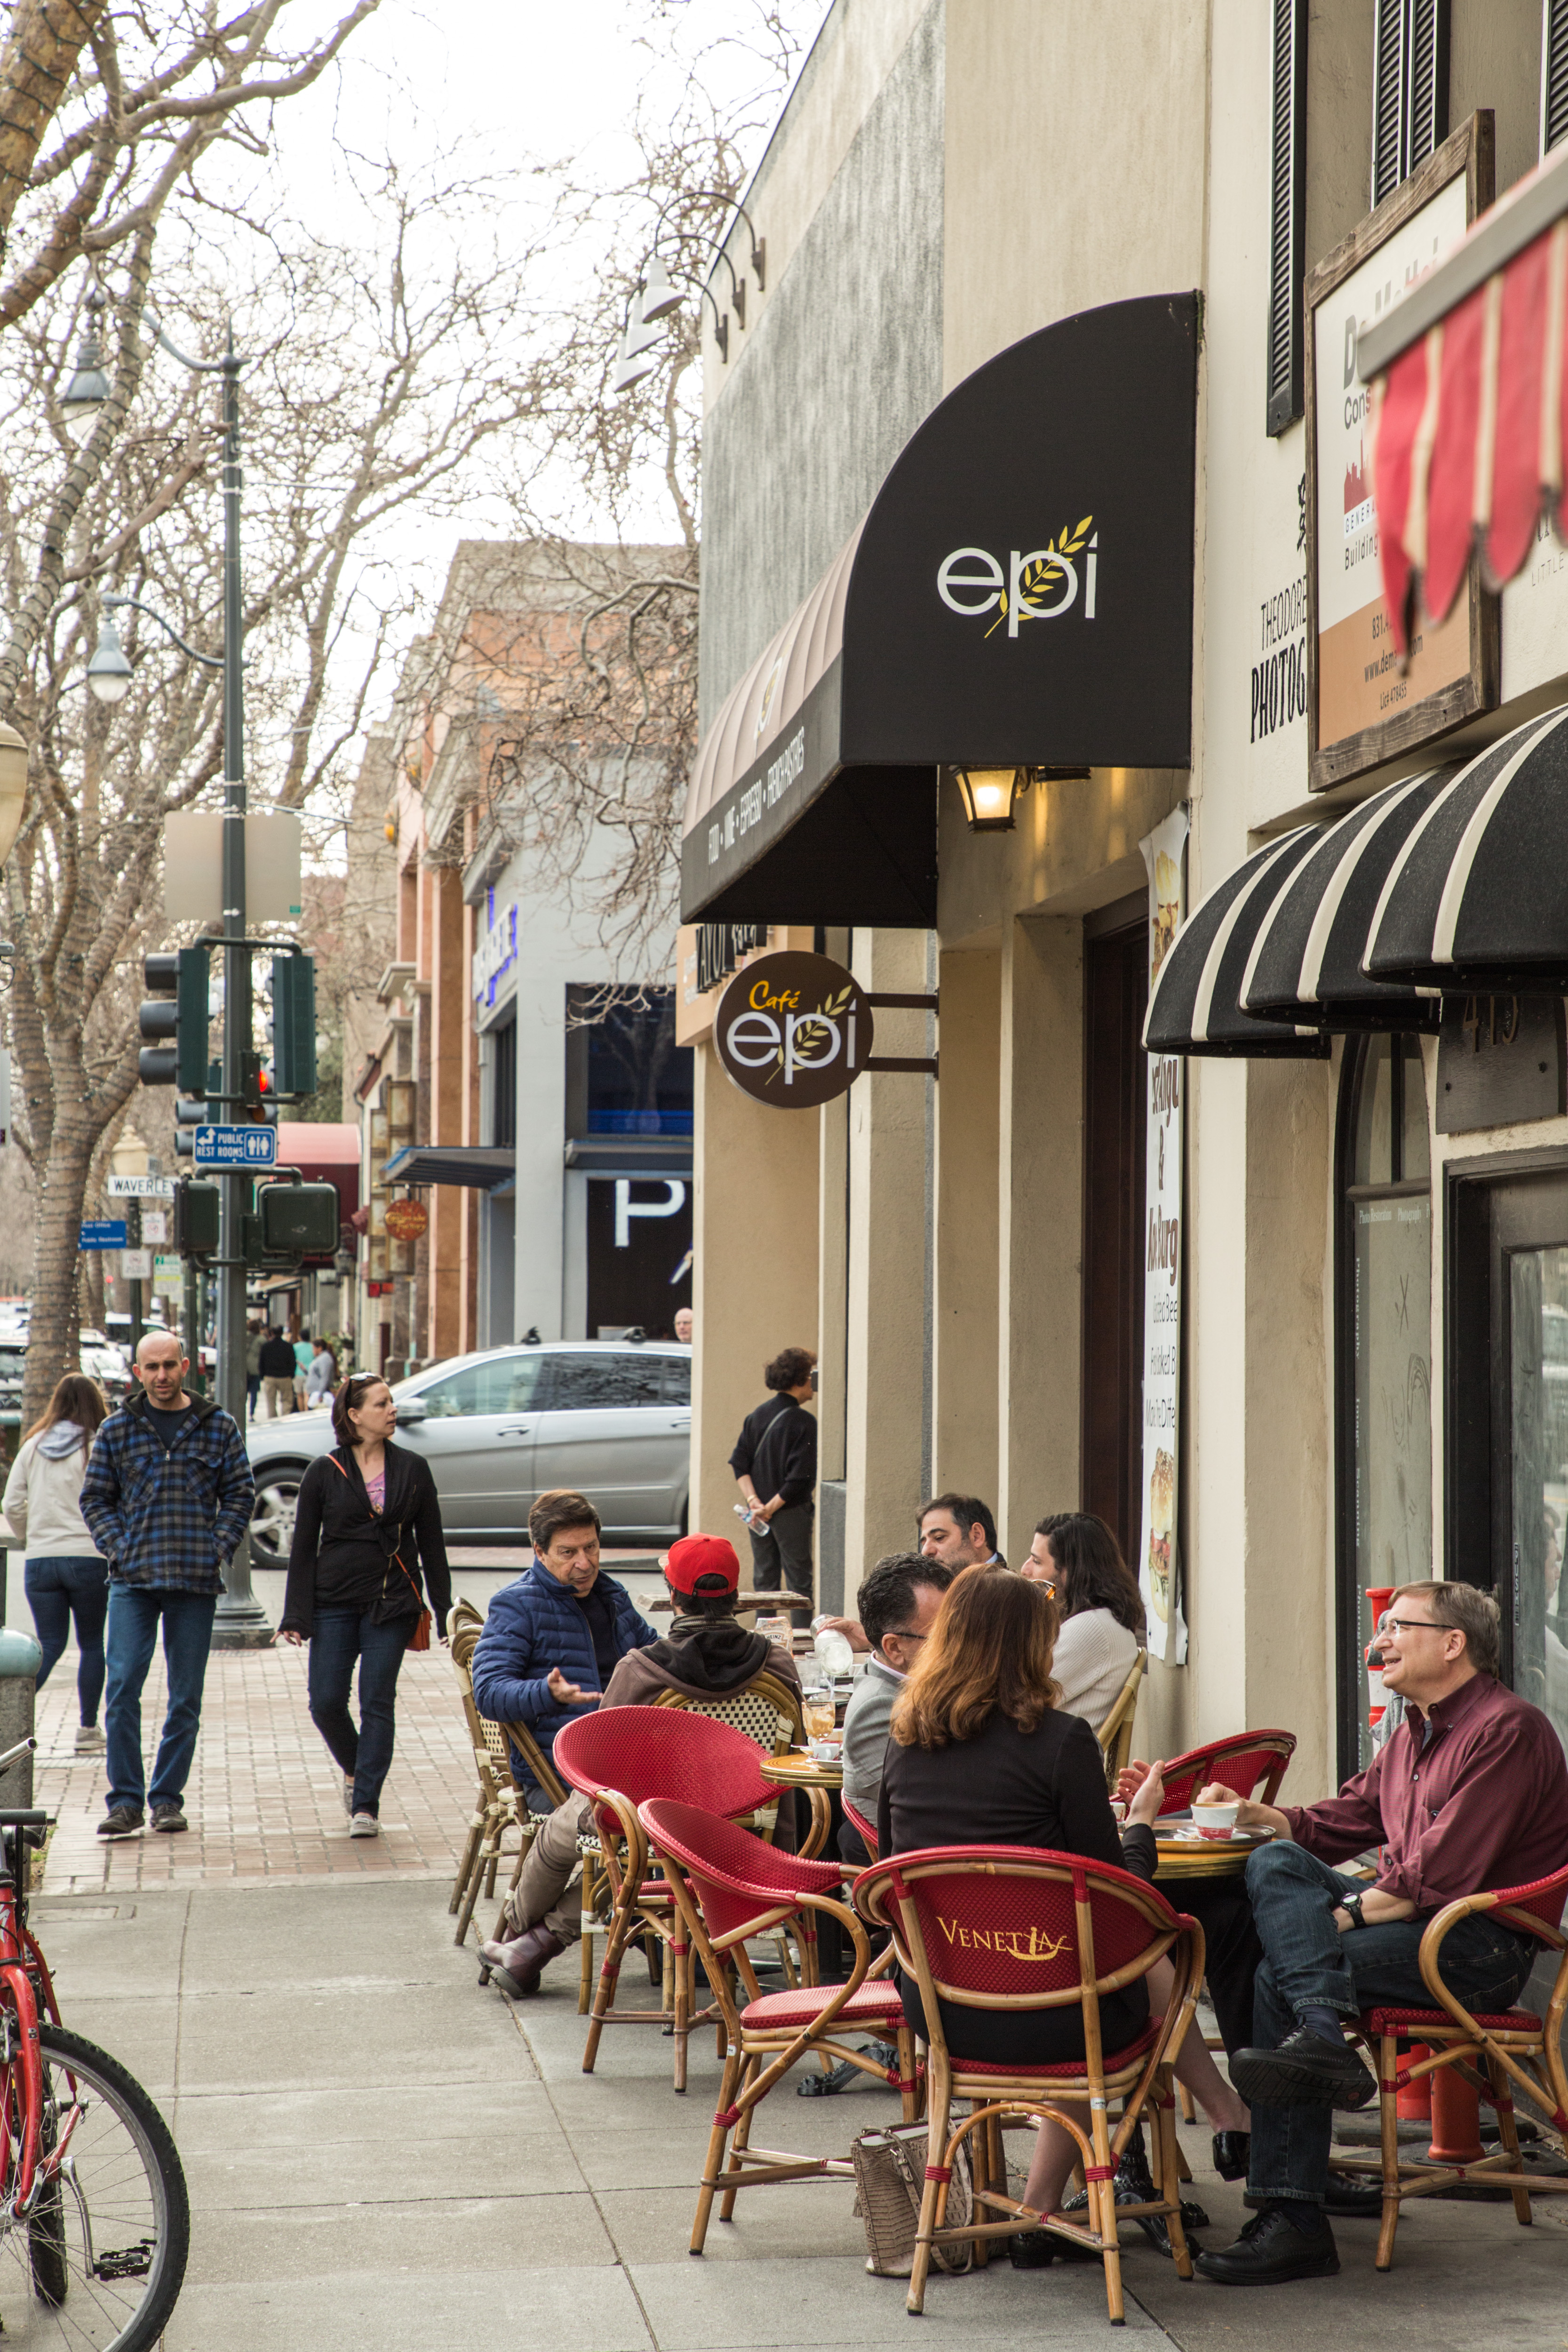
The retail economy is growing in Palo Alto.
Credit: Martin Klimek
The latest boom has extended not only to the South Bay and Peninsula — the traditional hubs of Silicon Valley — but also to neighborhoods in San Francisco and cities in the East Bay, most notably Oakland. In addition to bringing vitality and wealth, the rapidly growing and changing economy has also created significant challenges: adequate and affordable housing for people of all income levels, the displacement of long-time residents and a transportation system stretched past its limits.
Today a very successful economy has contributed to housing, transportation and environmental challenges that pose a risk to the region’s dynamism and diversity. Plan Bay Area 2040 addresses these challenges with a focus on urgent regional needs. As an update to the region’s long-range transportation plan and sustainable communities strategy, Plan Bay Area 2040 projects household and employment growth in the Bay Area over the next 24 years, provides a roadmap for accommodating expected growth, and connects it all to a transportation investment strategy that strives to move the Bay Area toward key regional goals for the environment, economy and social equity.
FIGURE 1.1 A snapshot of the Bay Area’s “Vital Signs.”
For 25 years the Bay Area has seen steady population growth coupled with “boom-and-bust” jobs cycles. Population and employment are now at their highest levels ever. Over this time home prices and list rents have fluctuated significantly and are now
at or near record levels. Freeway congestion delay per commuter and weekday rail ridership are also currently at record levels.
Source: Vital Signs; U.S. Census Bureau, 1990–2017; California Employment Development Department, 1990–2016; Zillow, 1997–2015; U.S. Census Bureau/American Community Survey, 1990–2015; realAnswers, 1994–2015; Metropolitan Transportation Commission,
1998–2017; Federal Transit Administration, 1991–2016
No matter what, the future will bring major challenges. Overburdened infrastructure, climate change, disruptive technological innovation, and the changing regional and national economy are just some of the many issues that will call for coordinated and concerted regional action. One challenge above all, however, requires immediate attention: housing.
The Bay Area’s housing affordability and neighborhood stability crisis has been decades in the making. Although the housing crisis has many components, its foundation is clear: there simply is not enough housing, whether market-rate or affordable, given the growing number of residents and jobs.
Instead of increasing housing supply to accommodate household and employment growth, for example, many local governments slowed permitting over time. Concurrently, the state and federal governments have pulled back financial support for affordable housing. Given a limited supply of both market-rate and affordable housing, combined with strong demand driven by exceptional regional economic performance, rents and home prices have risen rapidly. Today the Bay Area may have the most severe housing crisis of any of the nation’s large metro areas and, at this time, there are limited policy tools to help address the problem at a regional level.
The Bay Area’s rate of housing construction first started to lag in the mid-1970s. Each subsequent decade has seen lower levels of overall housing permitting, as seen in Figure 1.2. Since 1990, other metropolitan regions with strong economies and growing populations, such as Washington, D.C., Seattle and Denver, have permitted housing units at significantly higher rates than the Bay Area. New housing construction in the Bay Area has been much more akin to slower growing, older metropolitan regions such as Philadelphia and New York.
FIGURE 1.2 The historical trend for annual permitted housing units in the Bay Area.
This graph shows the historical trend of permitted units for both single-family and multi-family units in the Bay Area, stretching back several decades. As can be seen, annual growth in permitted units stagnated even during the employment booms of
the 1990s and 2010s.
Source: Vital Signs; Construction Industry Research Board, 1967–2010; California Homebuilding Foundation/Construction Industry Research Board, 2011–2015
There has been a particular mismatch between employment growth relative to the housing supply. Overall, the Bay Area has added nearly two jobs for every housing unit built since 1990. The deficit in housing production has been particularly severe in terms of housing affordable to lower- and middle-wage workers, especially in many of the jobs-rich, high-income communities along the Peninsula and in Silicon Valley. The booming regional economy combined with increased household formation among the millennial generation has further contributed to an evermore-acute housing crunch.
The widening income gap between high- and low-income households has further exacerbated the housing crisis. As seen in Table 1.1, the total number of households in the nine-county Bay Area increased by 20 percent from 1990 to 2015. The vast majority of this growth, however, was concentrated among households earning $150,000 or more annually, with the remaining growth among households earning less than $35,000 a year. Over a period spanning 25 years, there was a net decrease in the number of households earning between $35,000 and $149,999 in the Bay Area, as these households declined from 64 percent to 52 percent of total households in the region.
TABLE 1.1 A comparison of the number of households by income level in the Bay Area over a 25-year period from 1990 to 2015.
From 1990 to 2015, households earning more than $150,000 a year have greatly increased their share of the total number of households in the region and comprised a vast majority of the regional growth in households over the same period. As a share of
total households, those earning between $35,000 and $149,999 have declined significantly and in absolute numbers have either stagnated or decreased.
Source: U.S. Census Bureau, 1990; U.S. Census Bureau/American Community Survey, 2015 (Social Explorer)
These dynamics have had significant implications for the Bay Area housing market. With the increased number of higher income households and most income growth going to the top 20 percent, demand for housing has remained very strong at the upper end of the market. Conversely, it has become more difficult for low- and middle-wage households to compete for market-rate housing as a larger pool of high-wage workers bid up a limited housing supply. This has further intensified competition for scarce affordable housing opportunities.
What led to such a mismatch between housing supply and demand? Why does the Bay Area today lack so much needed housing, especially housing affordable to low- and moderate-income households? The causes of this situation are complex and there are many competing interpretations of the available evidence, including a range of economic and demographic factors that extend beyond the Bay Area itself.
Generally, however, the policy drivers — things that local, regional and state governments have the power to address or alleviate — fall into a few interrelated categories: regulatory barriers and tax policy challenges that act to restrict the production of all types of housing, especially infill development; and insufficient support for affordable housing.

The Bay Area faces a severe housing crisis.
Credit: MTC Archives
Affordable and low-income housing options are in short supply in the Bay Area.
Credit: MTC Archives
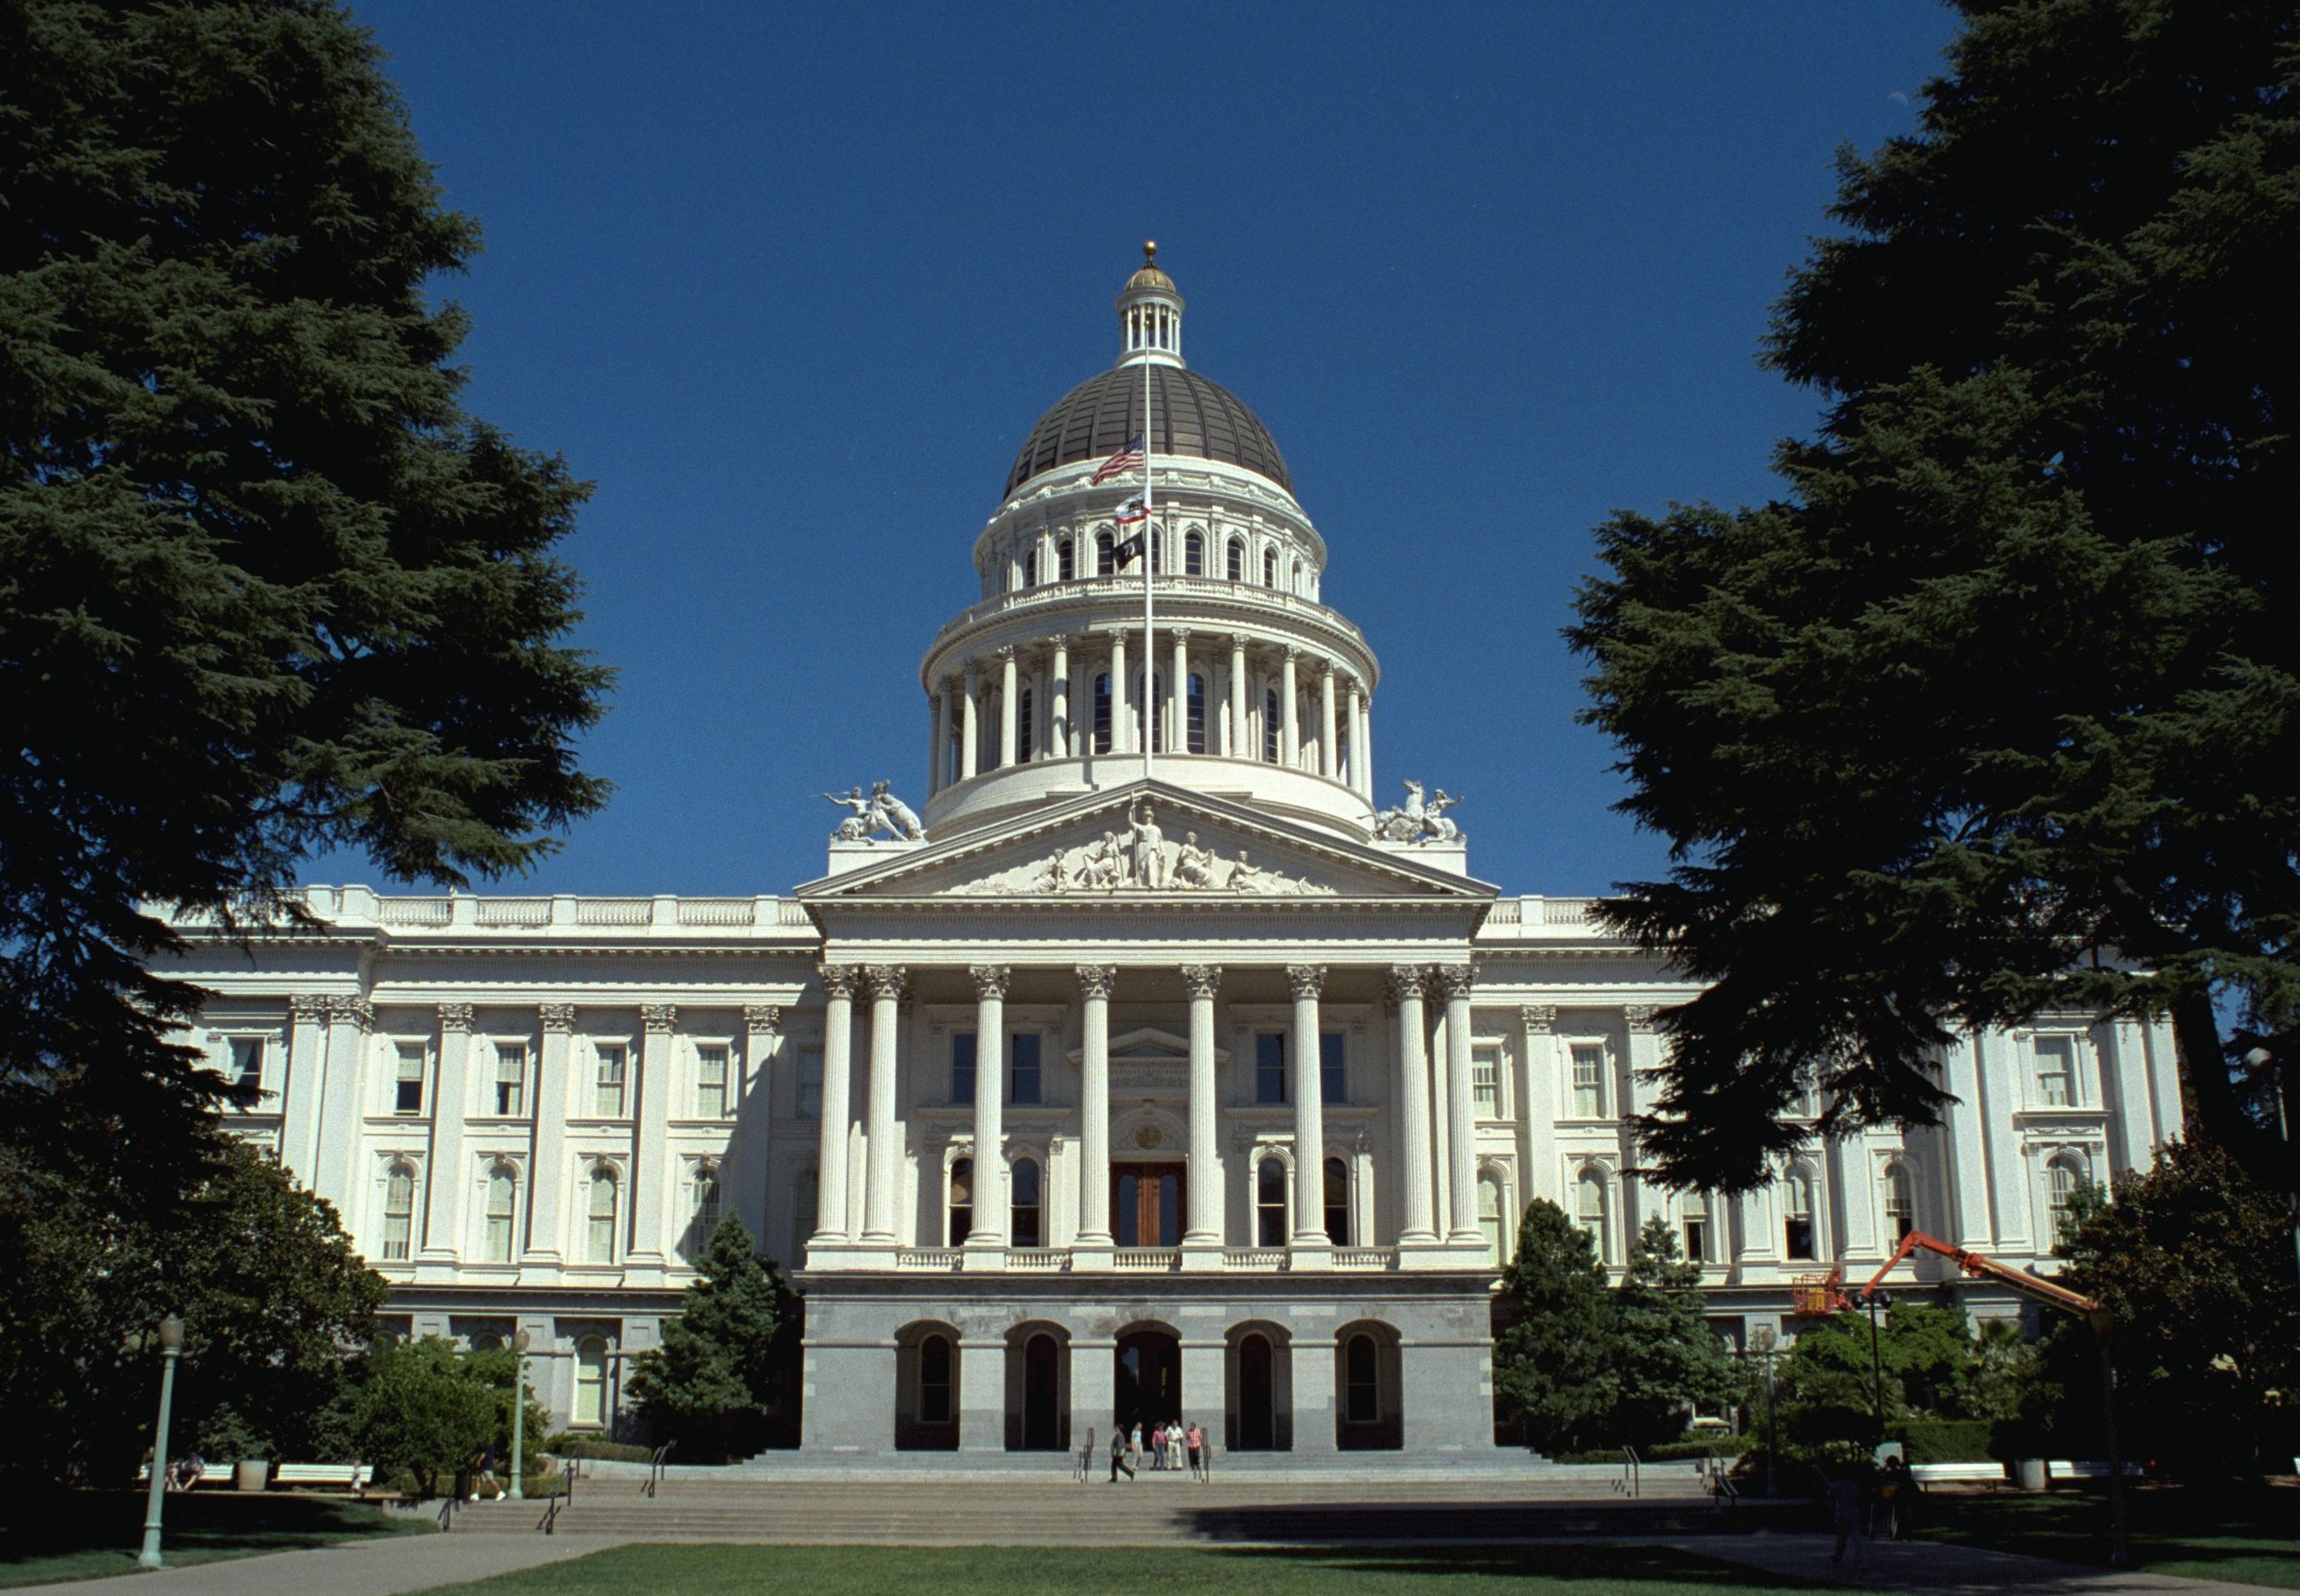
The dissolution of redevelopment agencies in California eliminated a major source of funding for affordable housing.
Credit: Henri Sivonen, Creative Commons Attribution 2.0 Generic license
Although the availability of developable land in the Bay Area is limited due to topography and protected conservation lands, state and local regulations often prevent instead of promote higher-density, mixed-use development in urban infill areas. Lengthy review processes in many communities stall transit-oriented projects long enough to make them infeasible, leading to the loss of grant funding and private investment that would otherwise flow into cities along with desperately needed new housing. The California Environmental Quality Act (CEQA) often acts as another obstacle to both affordable and market-rate housing. Although CEQA has been essential for improving air quality and protecting natural habitats, the law is sometimes used as a litigation tool for blocking projects that are otherwise designed to advance California’s environmental policy objectives, such as reducing greenhouse gas (GHG) emissions.
In addition, the current approach to taxation creates incentives to attract development that maximizes sales tax revenues and minimizes costs for public services (such as schools, police and social services), rather than encouraging more balanced approaches to land use. This trend — the so-called “fiscalization of land use” — has discouraged housing development and small business growth in many communities. The tax revolt measures of 40 years ago, such as Proposition 13 and other restrictions on new funding sources, caused many jurisdictions to view housing as a "fiscal loser" because property tax rates were capped below the cost of delivering services compared to retail or commercial development. Commercial property owners also often lack the motivation to develop vacant parcels since the cost of holding these properties is relatively low and a potential windfall from rising land values over time is relatively high.
Finally, as part of the 2011 Budget Act, the California Legislature approved the dissolution of the state’s 400+ redevelopment agencies. California is now one of a small number of U.S. states without tax increment financing to support urban infill development.
In addition to the regulatory and tax policy challenges cited above, recent years have seen major reductions in funding for affordable housing programs at both the state and federal levels. There has also been insufficient progress in the production of “naturally occurring” affordable housing — unsubsidized rental units that are affordable to low- and moderate-income households. This has severely affected the region’s low- and moderate-income households by further reducing the supply of new and existing affordable housing, whether government-subsidized or market-rate, especially given median wage deflation from 2000–2013.
Since 2000, for example, there have been cuts of over 50 percent to federal affordable housing programs, and most remaining federal funds go to rehabilitation rather than increasing supply. At the state level, the aforementioned dissolution of redevelopment agencies eliminated a large source of funding for affordable housing, including a loss of more than $200 million for the Bay Area in 2011 alone, according to Enterprise Community Partners and the Non-Profit Housing Association of Northern California.
The production of housing affordable to low- and moderate-income households has lagged behind production of housing affordable to higher-income households, with the most significant shortfall occurring in the moderate or middle income category — housing that is typically produced by the market without subsidy in most metro regions. From 1999 to 2014, the Bay Area issued permits for only about 35 percent of the units required to meet the needs of vulnerable populations such as low-income families, seniors and the homeless. This left over 100,000 needed affordable housing units unbuilt.
At the same time, much of the older housing stock that typically forms the backbone of “naturally occurring” affordable housing is located in higher density, transit rich areas that have experienced gentrification pressures and the loss of affordable units, further exacerbating the challenges of sluggish affordable housing production. Moving forward, the annual funding needed to build an adequate supply of low- and moderate-income housing through cost-restricted units rather than through market mechanisms is estimated at $1.4 billion annually, according to the Association of Bay Area Governments (ABAG).
The housing crisis raises major concerns about negative impacts to the region. Affordability, a primary concern of Bay Area residents, continues to be a major challenge. This in turn poses risks to the Bay Area’s socioeconomic diversity, transportation system, environmental goals and robust economy.
Housing affordability has significantly worsened over time. Home prices are at record levels in some counties and near record levels in the rest. Rent payments have almost doubled in real dollars since the 1970s. While median wages are close to the top nationally, the Bay Area has by far the highest median home sale prices of any major metro region in the country, as shown in Figure 1.3. The region is now also home to three of the five most expensive rental markets in the nation, according to Zillow.
FIGURE 1.3 Median home sale prices by metro area from 1997 to 2016.
Over the last 20 years the Bay Area has seen one of the “spikiest” real estate markets in the country, with bigger booms and busts than other large metros. In particular, prices have risen much faster in the Bay Area coming out of the recent Great
Recession.
Source: Vital Signs; Zillow, 1997–2016
The prospects and benefits of home ownership are simply out of reach for many Bay Area households. Amid the affluence and new wealth generated in the post-recession era, approximately 24 percent of the Bay Area’s population lives below 200 percent of the federal poverty level, and the vast majority of households with annual incomes below $50,000 experience an excessive housing cost burden, as shown in Figure 1.4.
FIGURE 1.4 Share of income spent on housing by Bay Area households in 2015, segmented by income level.
A significant majority of households earning less than $35,000 in the Bay Area spent more than 50 percent of their household income on housing in 2015.
Source: Vital Signs; U.S. Census Bureau/American Community Survey, 2015
While the cost of housing has increased significantly for both owner and renter households, renters are also at higher risk for displacement during periods of growth and expansion. Currently there are hundreds of thousands of lower-income households at risk of displacement in the Bay Area, with the majority of them living in San Francisco, Santa Clara and Alameda counties.
The lack of adequate tenant protections — or availability of subsidized or “naturally affordable” market-rate units in neighborhoods with quality transit service and other amenities — has accelerated the displacement of lower-income residents and even many businesses from the region’s core urban areas. As shown in Map 1.1, displacement is no longer just a San Francisco problem, but a region-wide challenge.
MAP 1.1 Bay Area displacement trends.
Scholars at UC Berkeley looked at regional housing, income and other demographic data to analyze and predict where gentrification and displacement are occurring or likely to occur in the future. Among the researchers’ key findings is that not only
are many low-income neighborhoods experiencing displacement, high-income neighborhoods are also rapidly losing their existing low-income populations. In addition, “[n]eighborhoods with rail stations, historic housing stock, and rising housing prices
are especially at risk of losing low-income households.”
Source: Urban Displacement Project/University of California, Berkeley, 2016
Given insufficient support for affordable housing, many individuals who perform important but lower- paying jobs face either substandard or overcrowded and unhealthy housing; costly, long-distance work commutes; or sometimes even homelessness — the most severe expression of the region’s housing shortage. Rising prices in the region’s core have driven many lower-income households to outlying jurisdictions farther away from jobs, transit and amenities, even as low- and middle-wage job growth has been concentrated in three counties: San Francisco, San Mateo and Santa Clara. This shift contributes to increased development pressures on open space and agricultural lands, more pollution from passenger vehicles, adverse health impacts, higher transportation costs, and greater levels of highway and transit congestion.
While roughly 97 percent of the Bay Area workforce lives in the nine-county region, ongoing regional affordability challenges mean thousands more households are moving east to the San Joaquin Valley and the Sacramento metro area every year. Although home prices are lower, these areas lack the same proximity to higher-paying jobs as some Bay Area communities. While many have relocated by choice, others have been displaced by gentrification and rising rents.
Goods movement hubs have also increasingly chosen to locate just east of the region’s boundaries, taking advantage of lower land prices and prevailing wages. At the same time, firms want to remain in close proximity to the Bay Area, both to deliver goods to the region’s residents and businesses and to maintain access to existing seaports, airports and industrial facilities.
These two trends — combined with limited transportation capacity — have resulted in growing congestion, especially at the Interstate 580 Altamont Pass gateway in eastern Alameda County and the Interstate 80 gateway in Solano County. In both cases, neighboring counties are taking on housing and commercial development unable to occur in the highly regulated, high-cost Bay Area development market. Senate Bill 375 (Steinberg, 2008) was enacted to encourage regions like the Bay Area to find solutions to this challenge, which has disproportionately affected lower-income residents and burdened them with hours-long commutes on crowded roads, buses or trains. In contrast to the original Plan Bay Area, Plan Bay Area 2040 plans for enough housing to accommodate not only the initial forecast of households but also the additional increment of projected in-commuters. At the same time, MTC is working collaboratively with the Sacramento and San Joaquin regions to improve transportation connectivity and boost the competitiveness of the “megaregional” economy.
The impacts of the booming economy and wider housing crisis, and the resulting disconnect between where people live and work, has contributed to record levels of freeway congestion and historic crowding on transit systems like Bay Area Rapid Transit (BART), Caltrain and San Francisco’s Municipal Railway (Muni). For example:
Overall commute time is at the highest level on record, as are time spent and miles traveled in highway congestion. As of 2015, the Bay Area’s most notorious traffic bottlenecks included U.S. 101 in San Francisco and Interstate 80 (I-80) in Alameda and Contra Costa counties.
Average weekday BART ridership is at the highest level on record. Two out of three BART trips now begin or end at the four downtown San Francisco stations, with Montgomery and Embarcadero stations approaching 90 to 100 percent station capacity during peak periods. Peak direction, rush-hour trains regularly exceed BART’s standard maximum of 107 passengers per car.
Caltrain’s daily ridership more than doubled in the last 10 years, from approximately 30,000 in 2006 to a record 62,400 in 2016. The 10 highest-demand trains operated by Caltrain now have ridership exceeding 100 percent of seated capacity.
Muni continues to be the region’s most heavily-used transit system; ridership has grown by six percent in the last decade. Morning peak-hour ridership in the Market Street tunnel has grown by one-third in the last five years and several Muni Metro lines are at capacity during peak travel times.
These congestion and capacity challenges are already imposing costs on the Bay Area in terms of environmental impacts and lost time, and are likely to increase in the future without meaningful action to improve the jobs-housing balance in the region.
Over the medium- and long-term, the Bay Area’s housing crisis and its attendant transportation challenges could act as a significant drag on the region’s future economic growth and dynamism. Companies will have to contend with an artificially limited employment base, potential workers will be denied access to the benefits of a highly productive regional economy and a maxed-out transportation network at peak hours could limit the growth of regional job centers.
There is a significant body of research showing that housing supply constraints lead to significant productivity, income and welfare losses. Researchers at UC Berkeley and the University of Chicago estimated the United States loses out on trillions of dollars in potential economic output because of regulatory housing supply constraints in just two regions: the New York metro area and the San Francisco Bay Area.
Researchers at Harvard have posited that the increasing prevalence of land use restrictions has led to increased income inequality over the last 30 years compared to the period from 1940 to 1980, when workers’ ability to move from low- to high-productive regions led to income convergence and decreased inequality.
The challenges of the housing crisis are undeniably daunting. However, the Bay Area has risen to the occasion many times to address seemingly intractable policy issues. Whether for the environment, transportation or economy, the Bay Area has a history of coming together to address shared challenges.
Local and regional actions in the 20th century protected the Bay Area from unchecked sprawl, degrading air quality and a shrinking bay. Starting in the 1960s amidst a regional outcry over pollution and the filling of the bay, the San Francisco Bay Conservation and Development Commission was created to discourage bay fill and restore wetlands. Since 1969, the surface area of San Francisco Bay has grown by nearly 19,000 acres. Similarly, the Bay Area Air Quality Management District (Air District) was tasked with improving the region’s air quality. Between 1999 and 2015, for example, regional annual average particulate matter concentrations declined by 39 percent. These air quality improvements are estimated to have added a full year to residents’ lifespans, according to the Air District.
A strong local movement to protect greenfields from development also emerged during the latter half of the 20th century to protect farmland and open space. Local governments adopted urban growth boundaries and helped lead a “focused growth” strategy with support from environmental groups and regional agencies to limit sprawl, expand recreational opportunities, and preserve scenic and natural resources. Despite strong economic growth and population increases since the end of the Great Recession, the Bay Area has experienced less greenfield development than in decades past, a result that can be attributed to these local policies. Nonetheless, our success at protecting open space has further constrained our ability to build the housing needed for a growing population.
Faced with declining support from the federal and state governments, the Bay Area adopted a “self-help” approach toward funding transportation. Starting with a pioneering effort led by Santa Clara County in 1984, eight of the nine Bay Area counties have enacted local transportation sales taxes.
Bay Area voters also approved Regional Measure 1 in 1988 and Regional Measure 2 in 2004, which together raised tolls on the Bay Area’s seven state-owned toll bridges—and billions of dollars for important transportation projects in the bridge corridors and their approaches, as seen in Map 1.3. Altogether, voter-approved "self-help" measures generated some $2.5 billion for Bay Area transportation in 2016 alone, as shown in Figure 1.5. Although the region has many transportation needs and challenges, these needs can be alleviated through sufficient and continued resource investment coupled with more efficient use of our existing infrastructure.
FIGURE 1.5 “Self-Help” funding for transportation in the Bay Area.
Bay Area voters have approved a variety of measures beyond transit operator revenues and the typical local, state and federal sources to help fund transportation needs.
Source: Metropolitan Transportation Commission, 2016
Faced with a rapidly changing and evolving world, the Bay Area has reinvented its economy several times in the last half century. An economy dependent on defense spending and financial headquarters in the 1980s was transformed first by an explosion in high-tech manufacturing and later by software and computer-related design and services as semiconductor and computer manufacturing shifted offshore. More recently new innovations from social media to biotechnology have been incubated in the region. The Bay Area today is widely recognized as the global center for technological innovation, with countless metropolitan regions across the world trying to replicate the Bay Area’s success.
Although the reinvention of the Bay Area economy was aided by a number of fortunate events, it was also facilitated by the deliberate effort of people and institutions. As demonstrated by a research team at UCLA, dense networks of business, government, academia and civil society saw the emergence of the new economy and actively worked to ensure its health and success in the region.
What all these examples show is that the Bay Area can solve serious problems when citizens and key institutions — including business, government, academia and the non-profit sector — work together toward common goals.
Thus far, the Bay Area’s residents and communities have not made the same commitment to solve the housing crisis. Yet there is no more time to wait. Failure to establish regional consensus and take concerted action will put the Bay Area’s historic economic, environmental and transportation accomplishments at risk. Unlike many other policy areas, housing policy is something local governments have significant control over.
The Bay Area must therefore pursue a multi-pronged strategy that emphasizes the construction of new homes for residents of all incomes, the protection of the region’s most vulnerable households, and the need to advocate for more financial resources to pursue local and regional solutions. This strategy — and the avenues through which it may be executed — is further discussed in the final section of this document, “Action Plan”.
If the Bay Area rises to this challenge, future residents will be able to look back and say that the region built on its past successes to achieve broadly shared goals: abundant and affordable housing close to jobs and transit; clean air; clean water; a protected shoreline; and healthier, wealthier and more resilient communities in a great, 21st century metropolitan region.